DBA Dash
Free, open-source SQL Server monitoring
DBA Dash is a free, open-source (MIT licensed) monitoring tool for SQL Server DBAs. It covers performance monitoring, daily health checks and configuration change tracking across your whole SQL Server estate. I created it, and since its first public release in January 2022 it has grown through regular releases into a mature, widely used tool. It’s developed in the open on GitHub under Trimble’s open-source program.
Documentation, downloads and release notes live on the DBA Dash website: dbadash.com
What it does
Performance monitoring
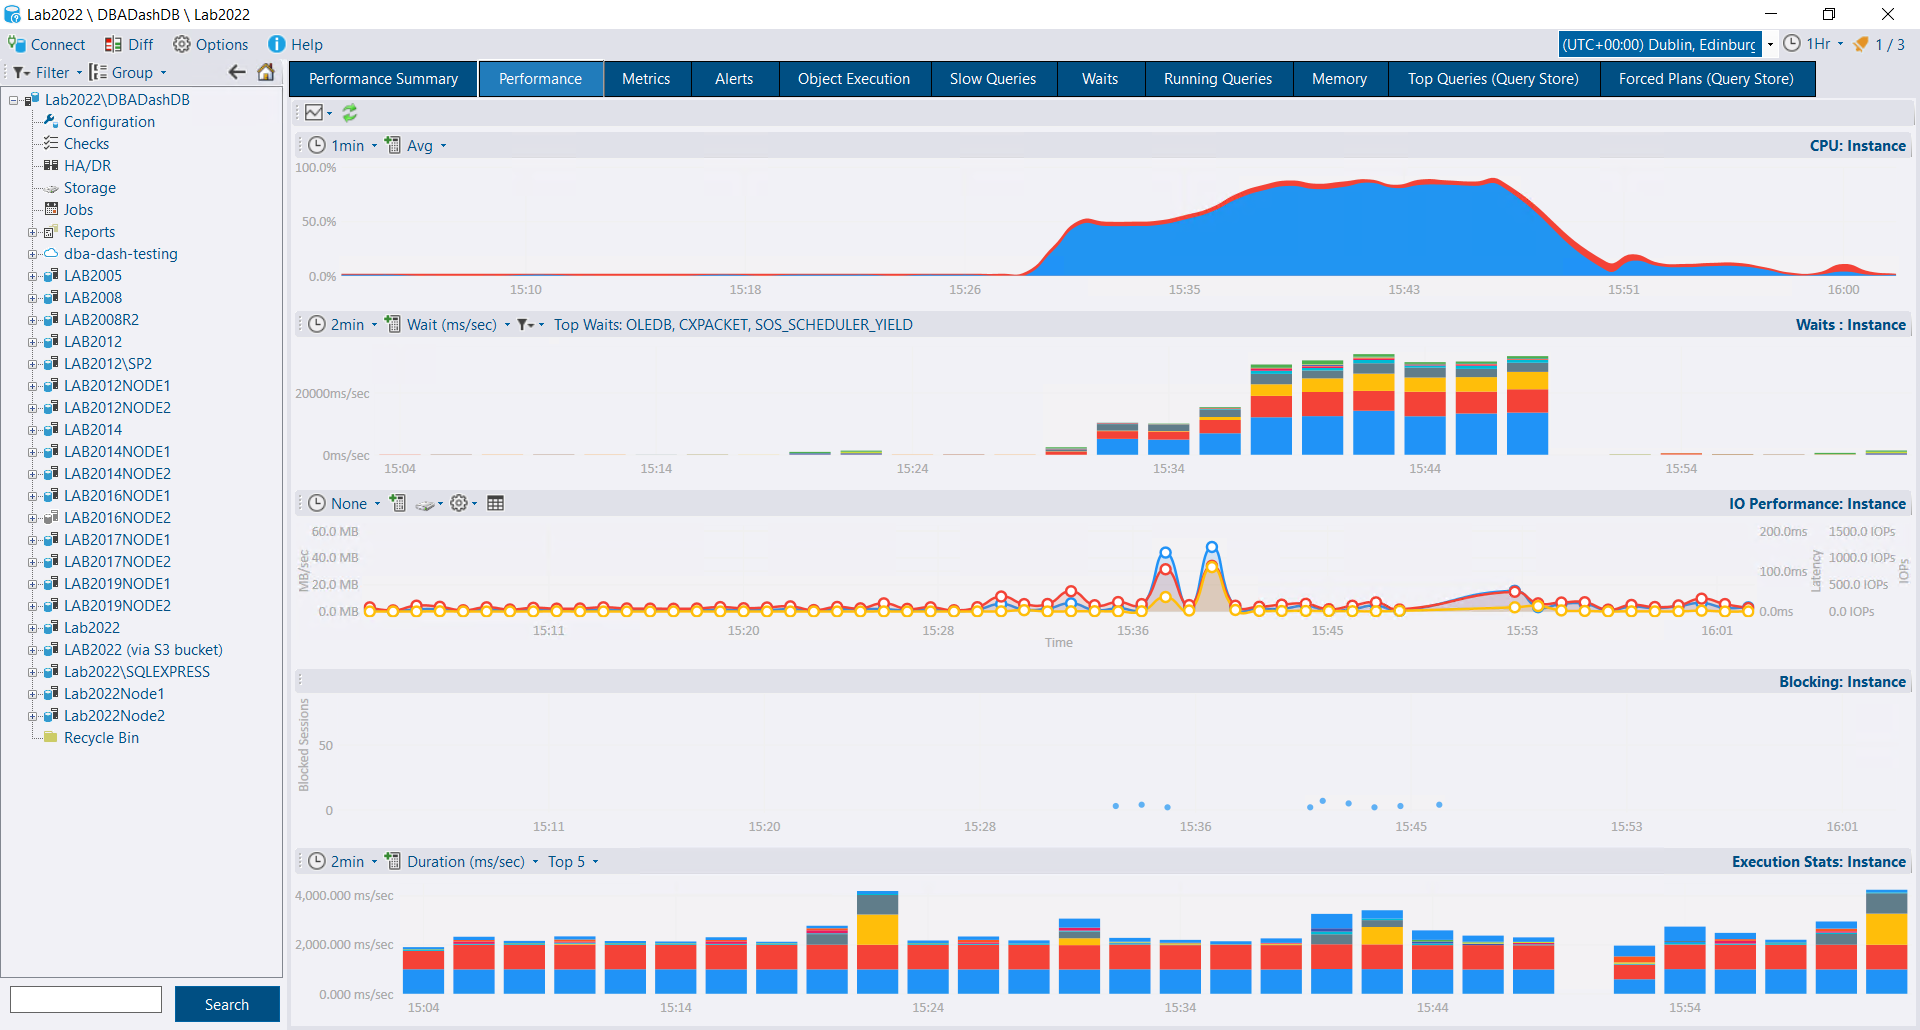
Monitor CPU, IO, waits, blocking, running queries, slow queries, stored procedure execution stats, performance counters, memory and more. Drill into a single instance to see what happened and when, and compare stored procedure performance with yesterday or last week to spot regressions.
Waits
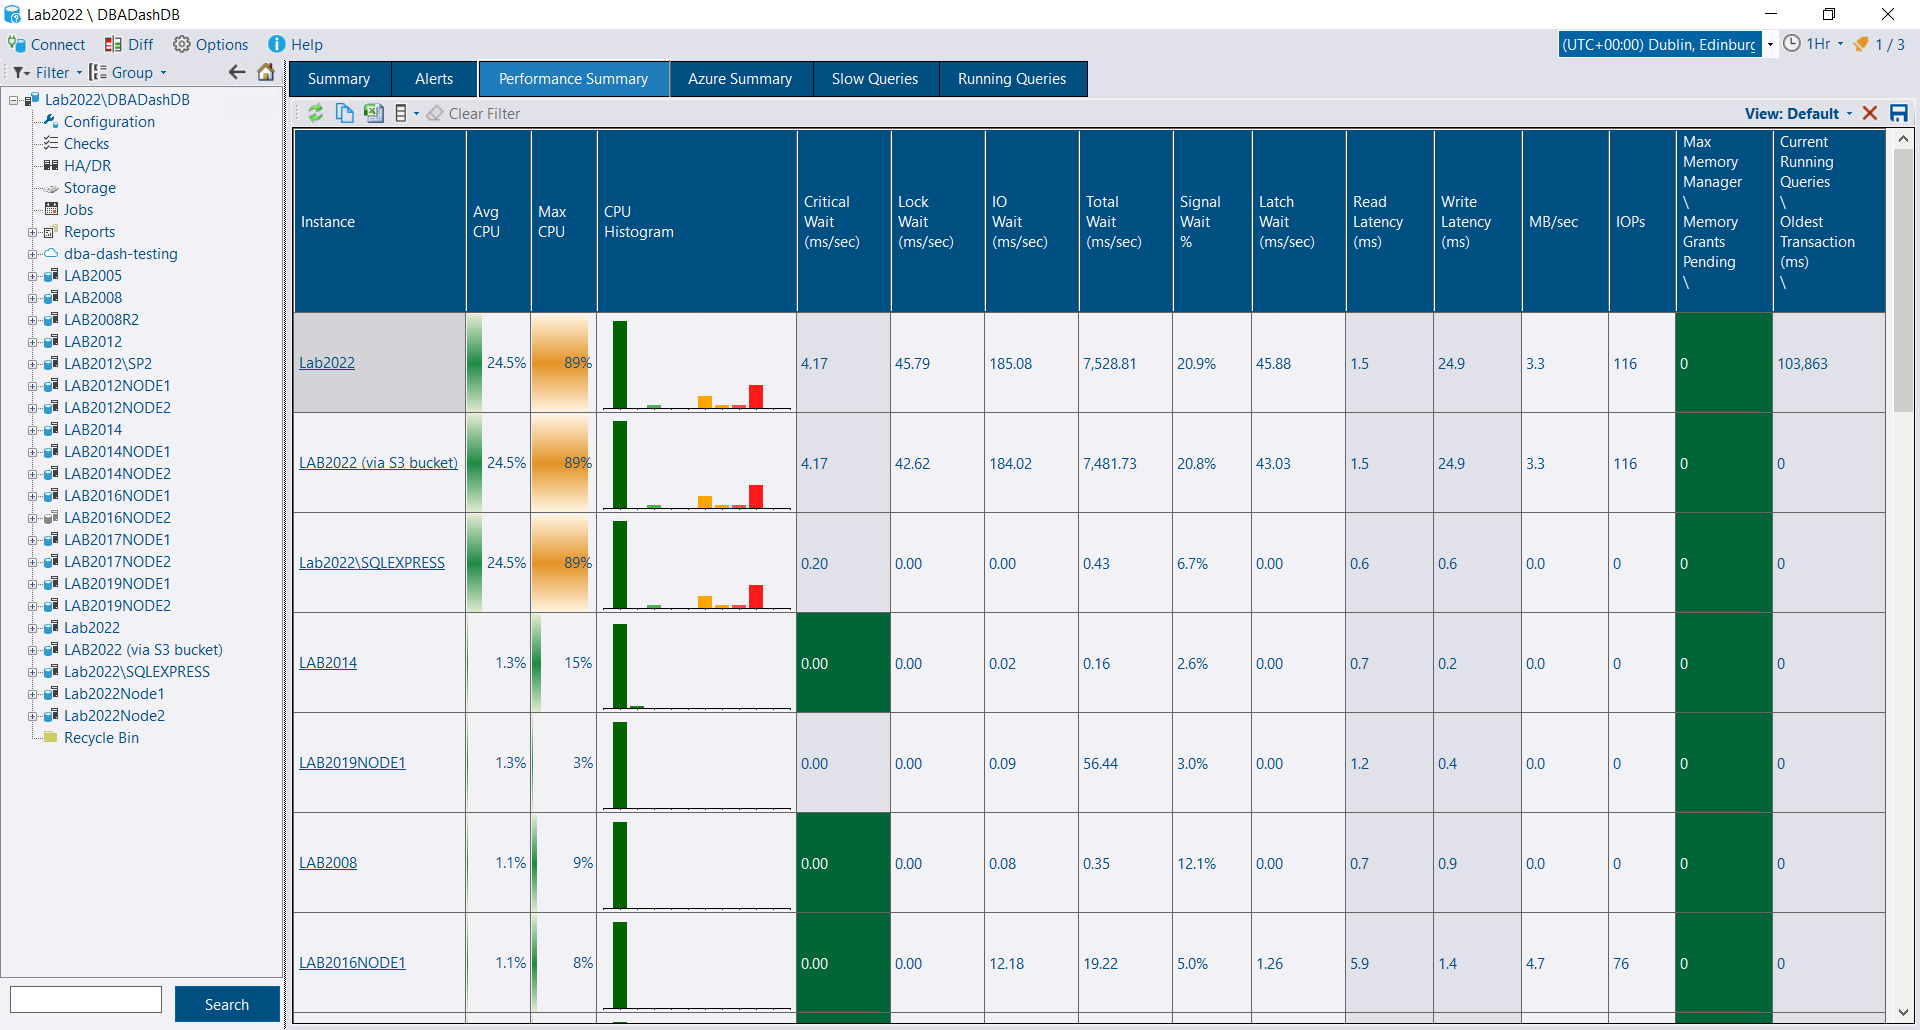
See which waits matter most for an instance and track them over time. Is it IO bound? Is there blocking? Is it running out of worker threads, or waiting on memory grants?
Running queries
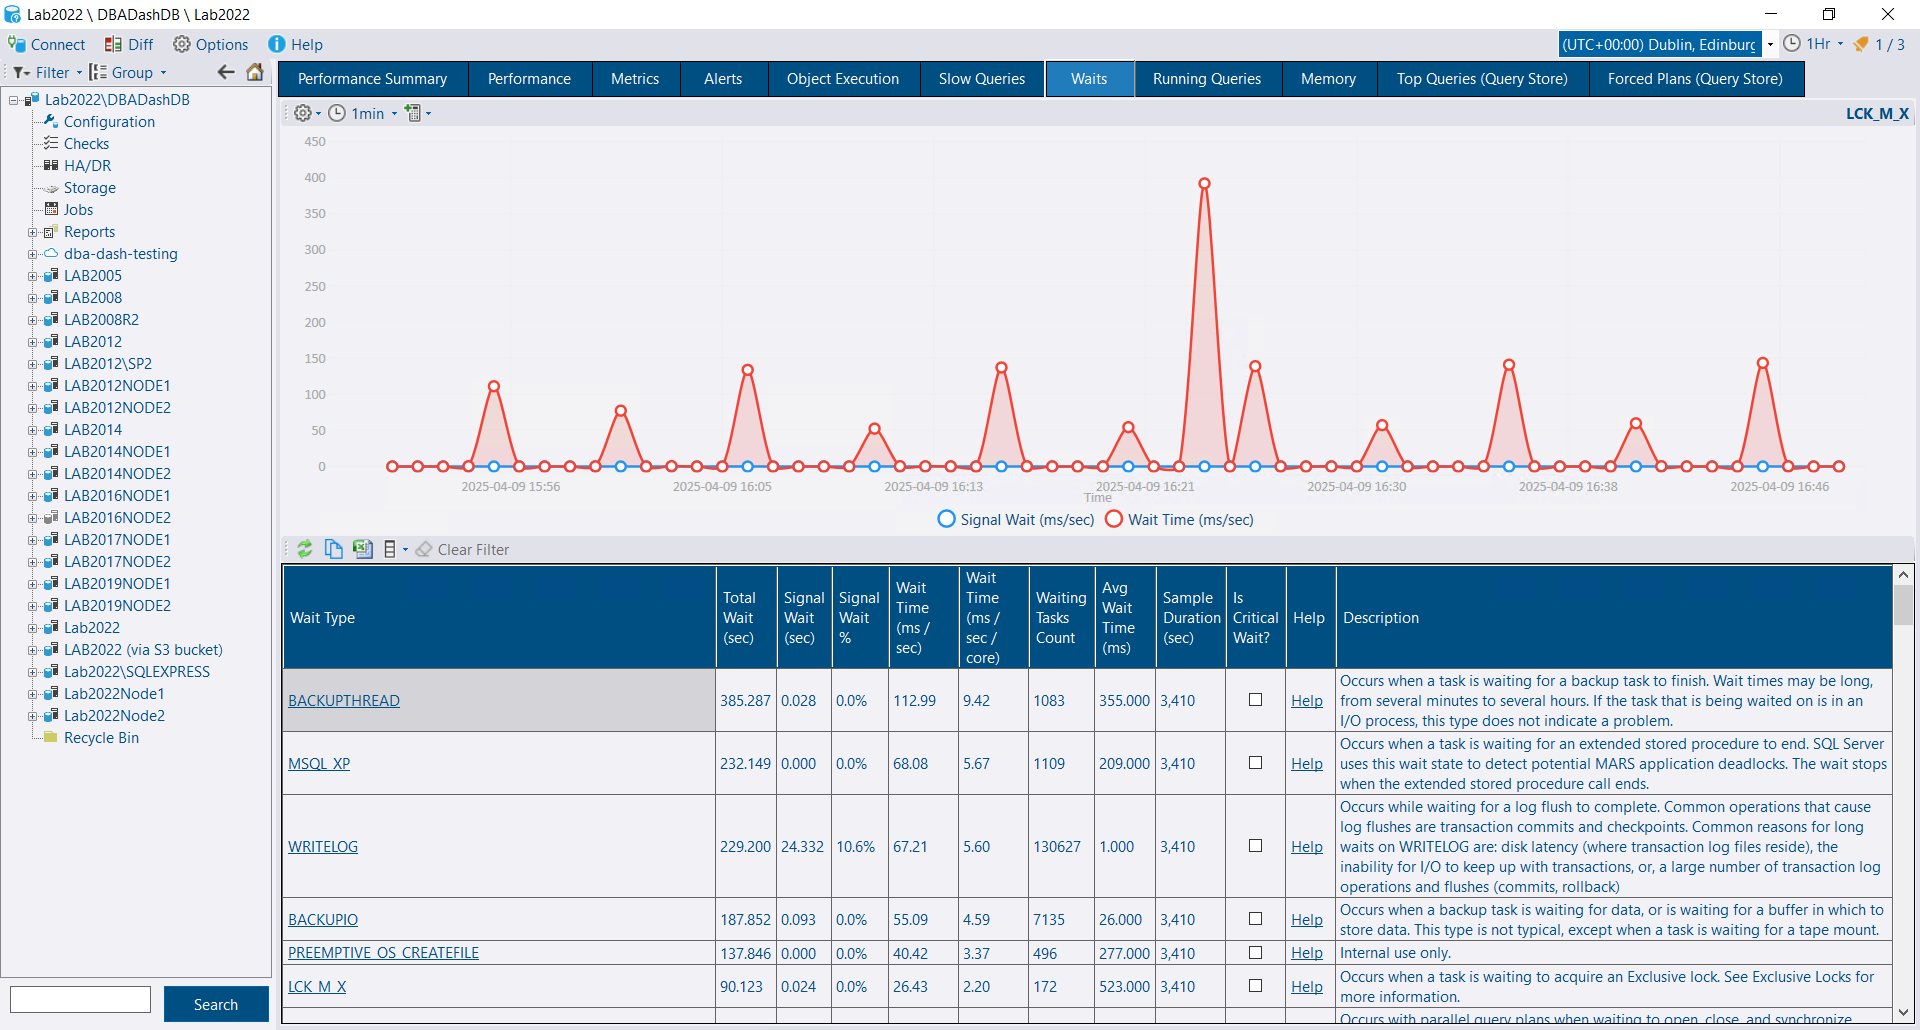
See what was running at any point in time, not just right now. Blocking chains show the root blocker, and you can view execution plans, query text (including parameter values), wait resources and tempdb contention.
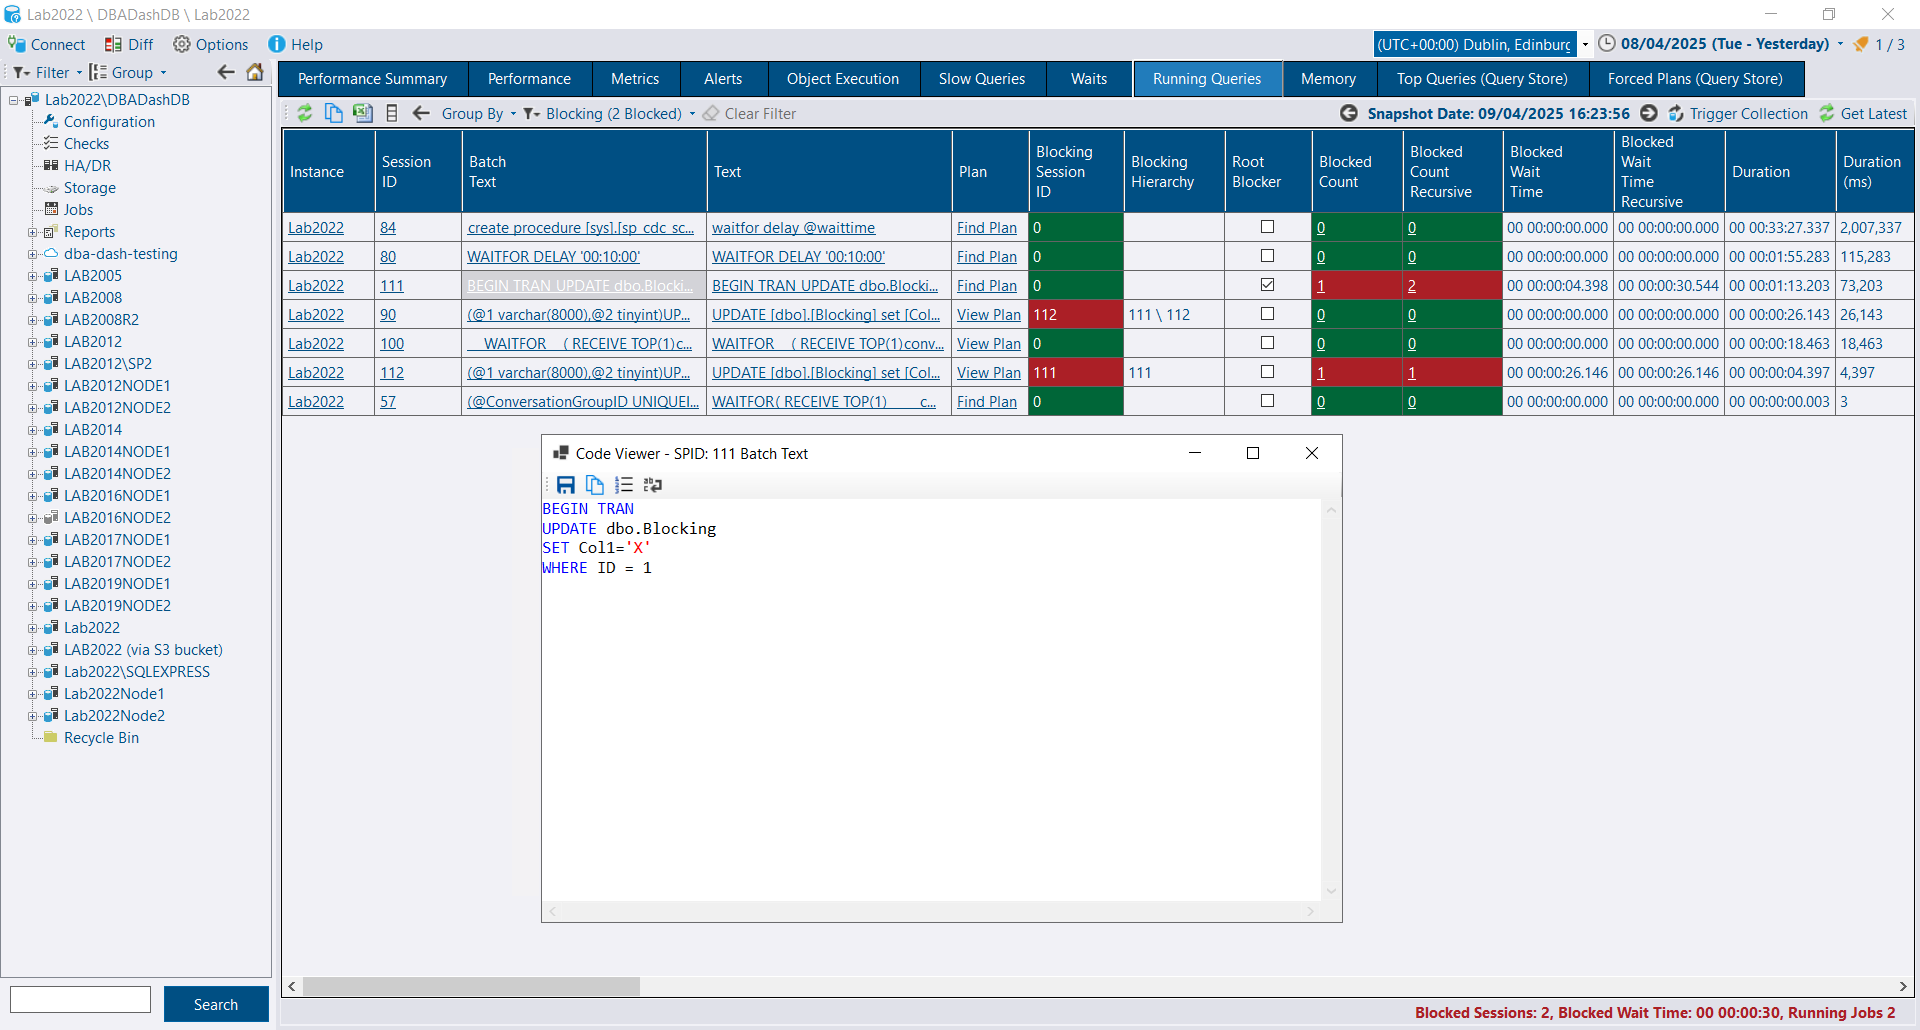
Slow queries
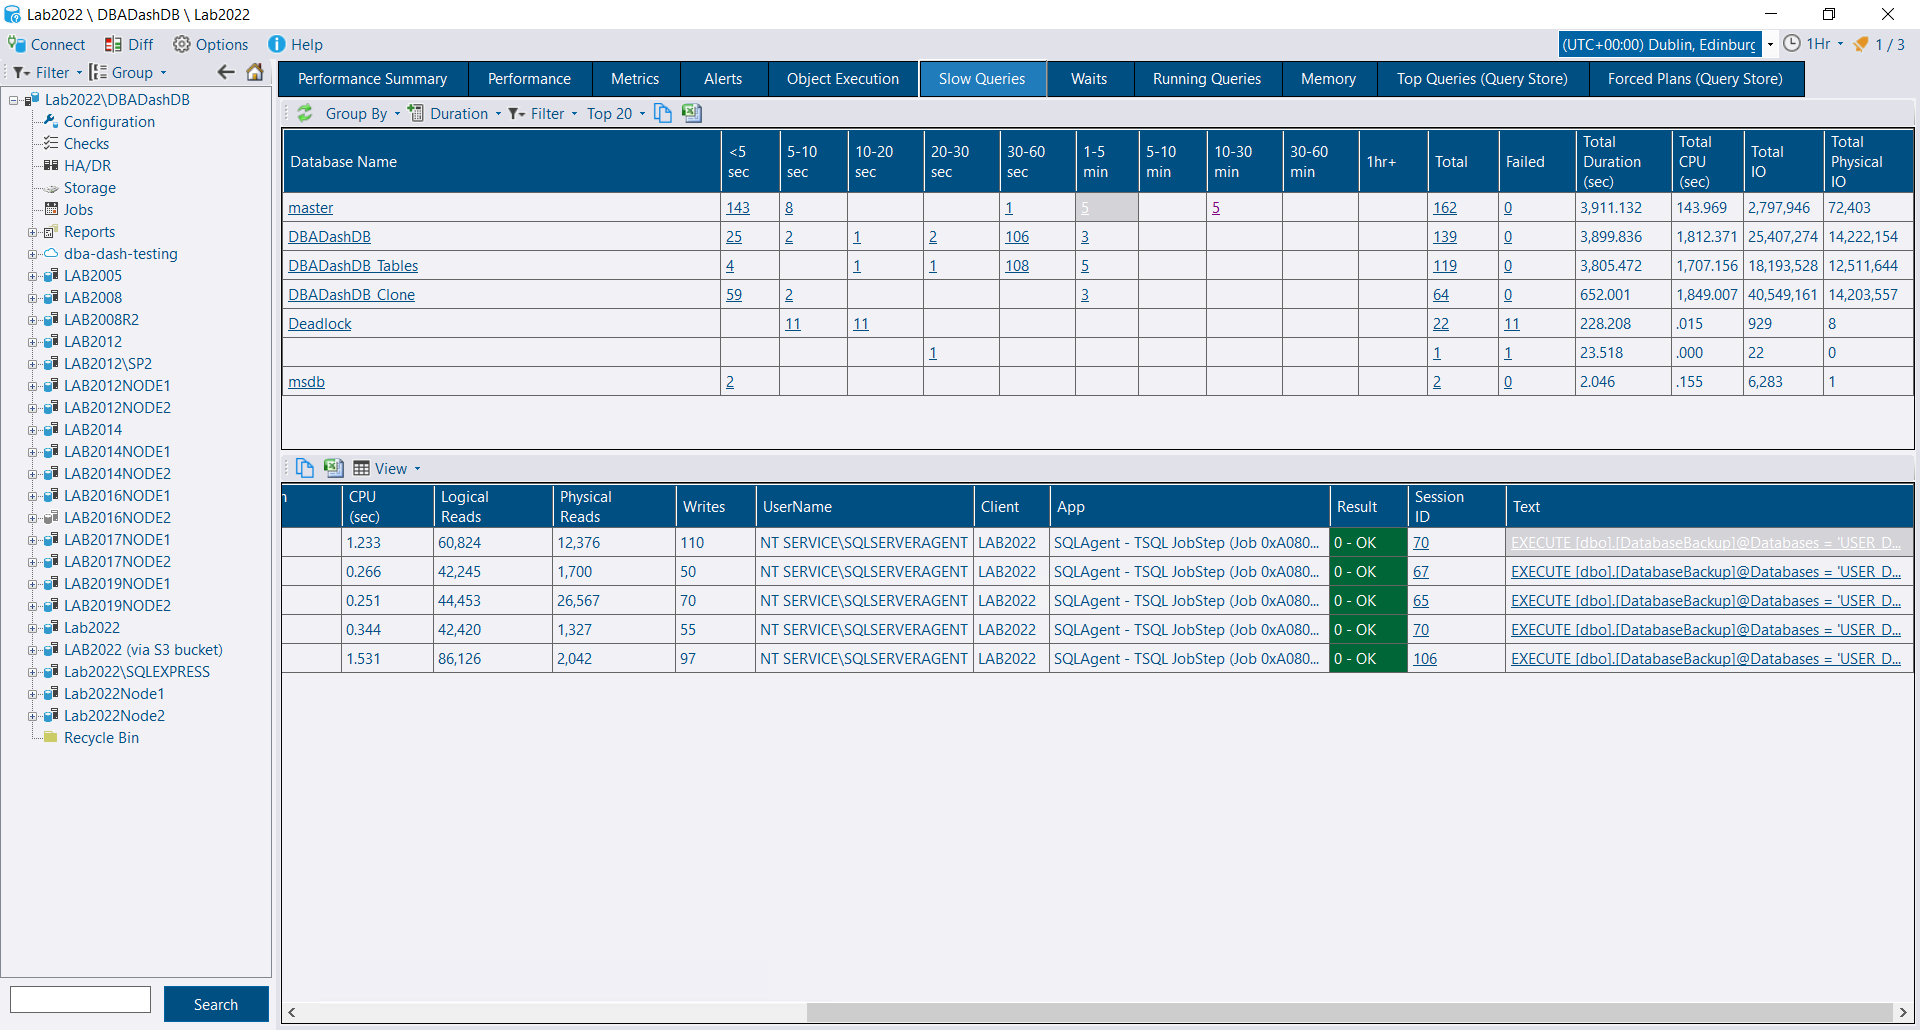
Slow queries are captured with extended events and can be sliced by app, database, client, object and result, with the query text and parameters. They link to running query snapshots, so you can see what a query was doing during its execution and say with confidence why it was slow.
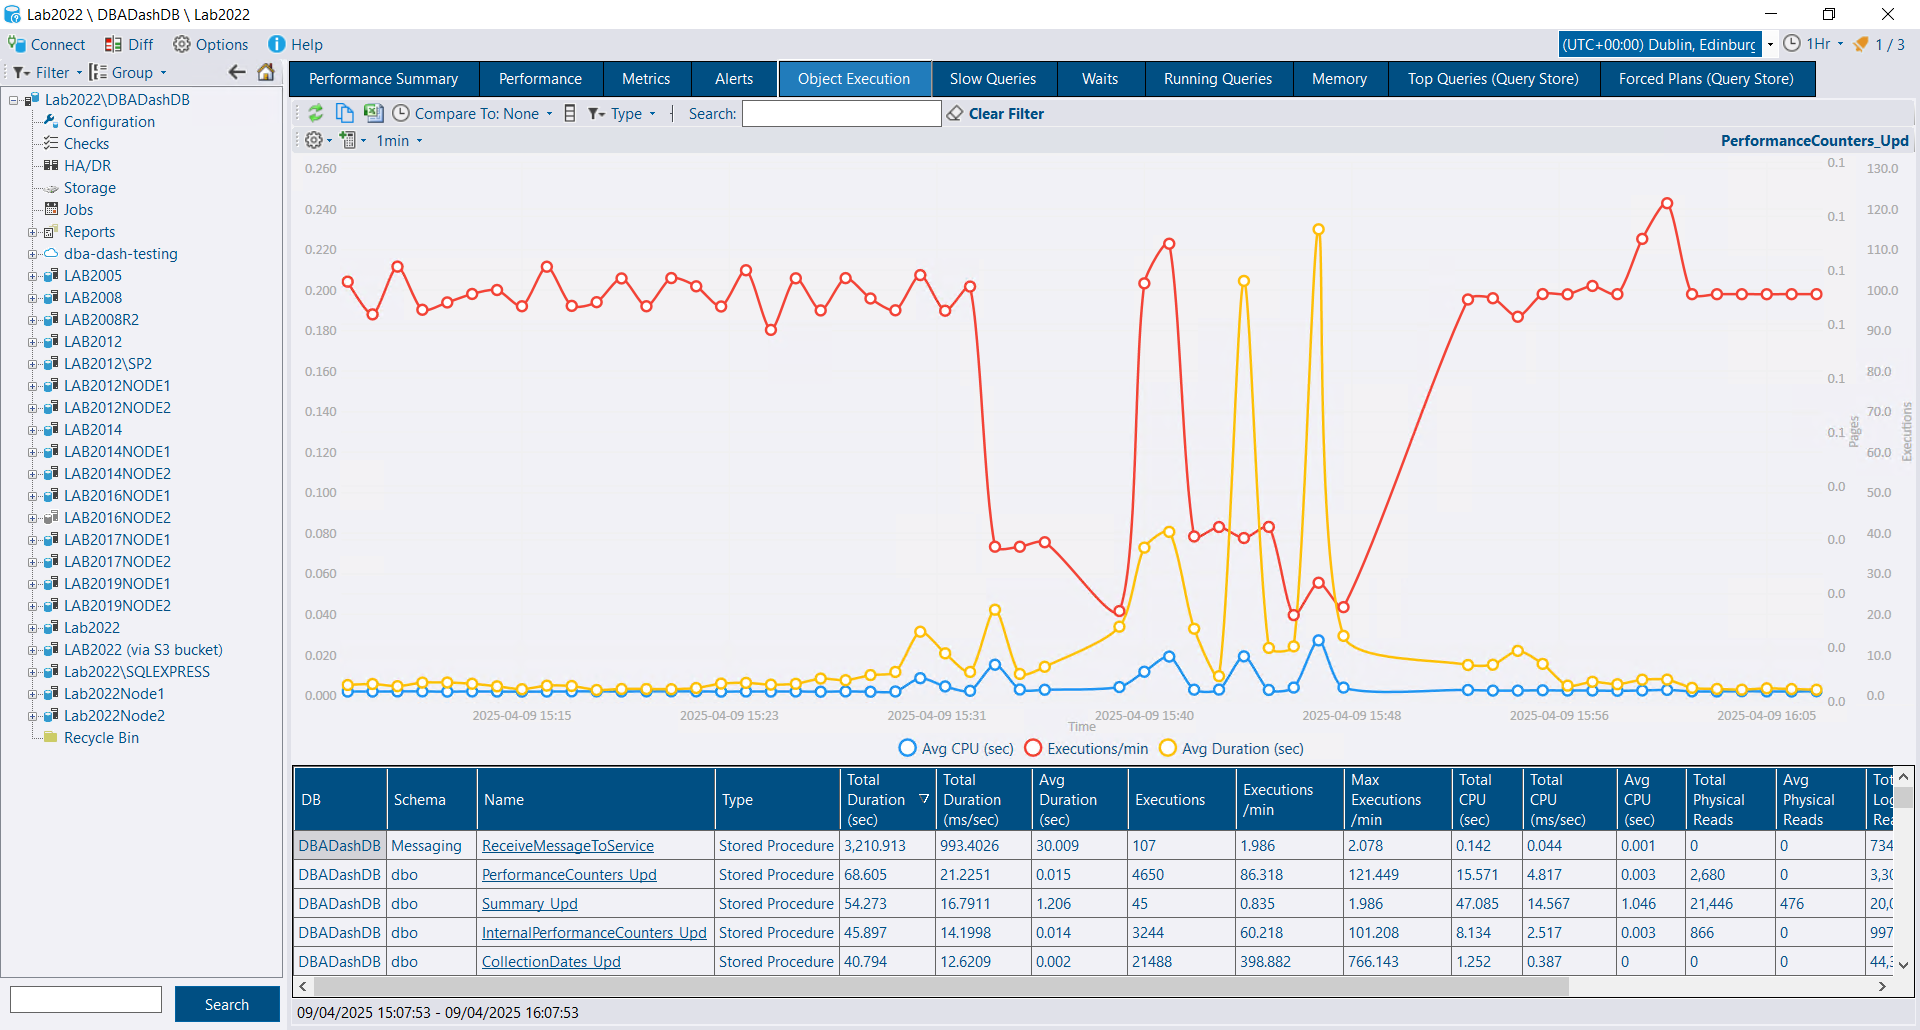
Object execution stats
Track stored procedure, function and trigger performance over time: which use the most CPU or IO, which run most often and which are slowest.
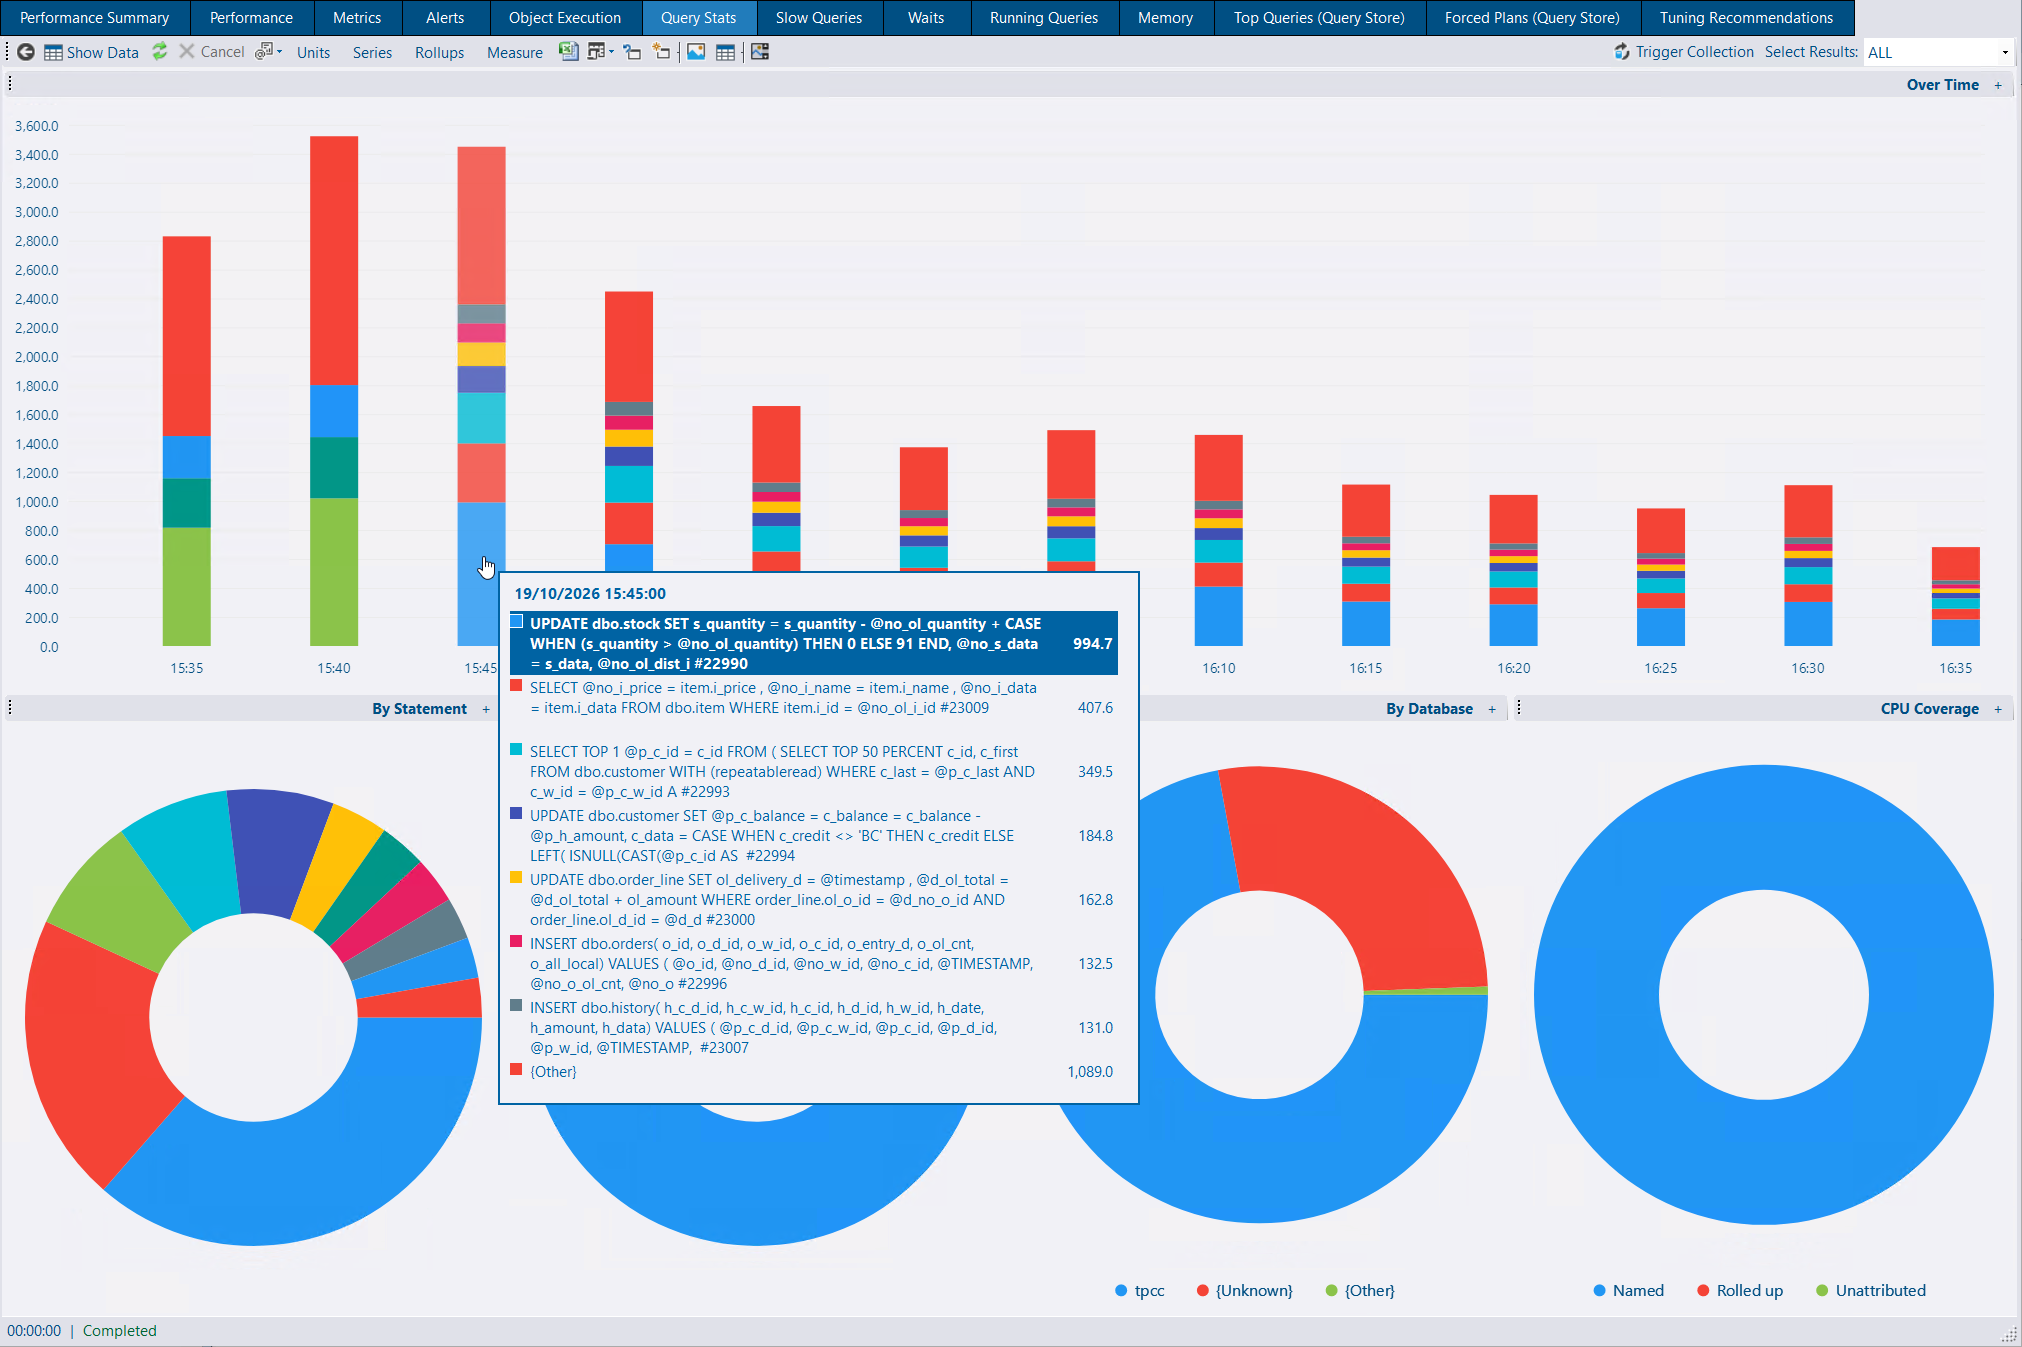
Query stats
Statement-level CPU from the plan cache, including ad-hoc queries, charted over time and by statement and database.
Daily DBA checks
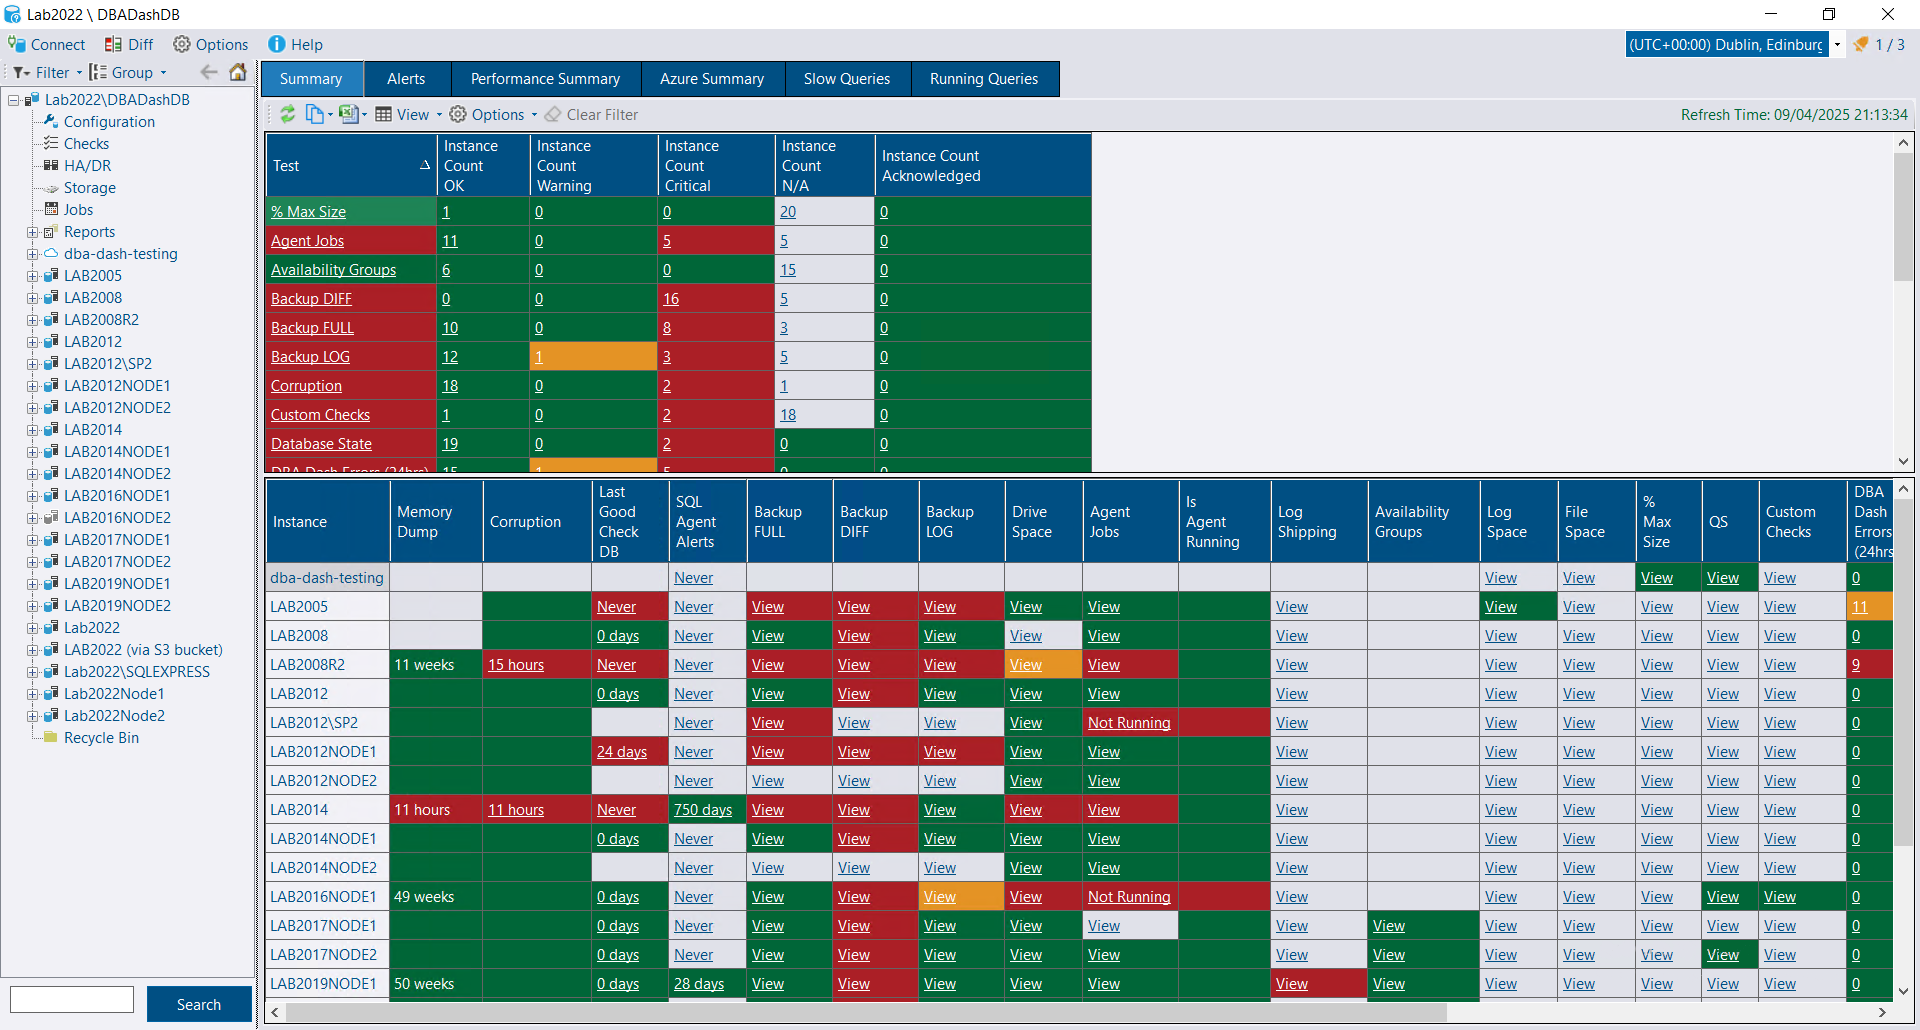
See the health of every instance on a single dashboard: backups, DBCC checks, corruption, memory dumps, agent jobs, availability groups, log shipping, mirroring, drive and database space, Query Store, identity columns and your own custom checks. Thresholds can be tuned to suit your environment, and alerts can notify you when something needs attention.
Configuration and change tracking
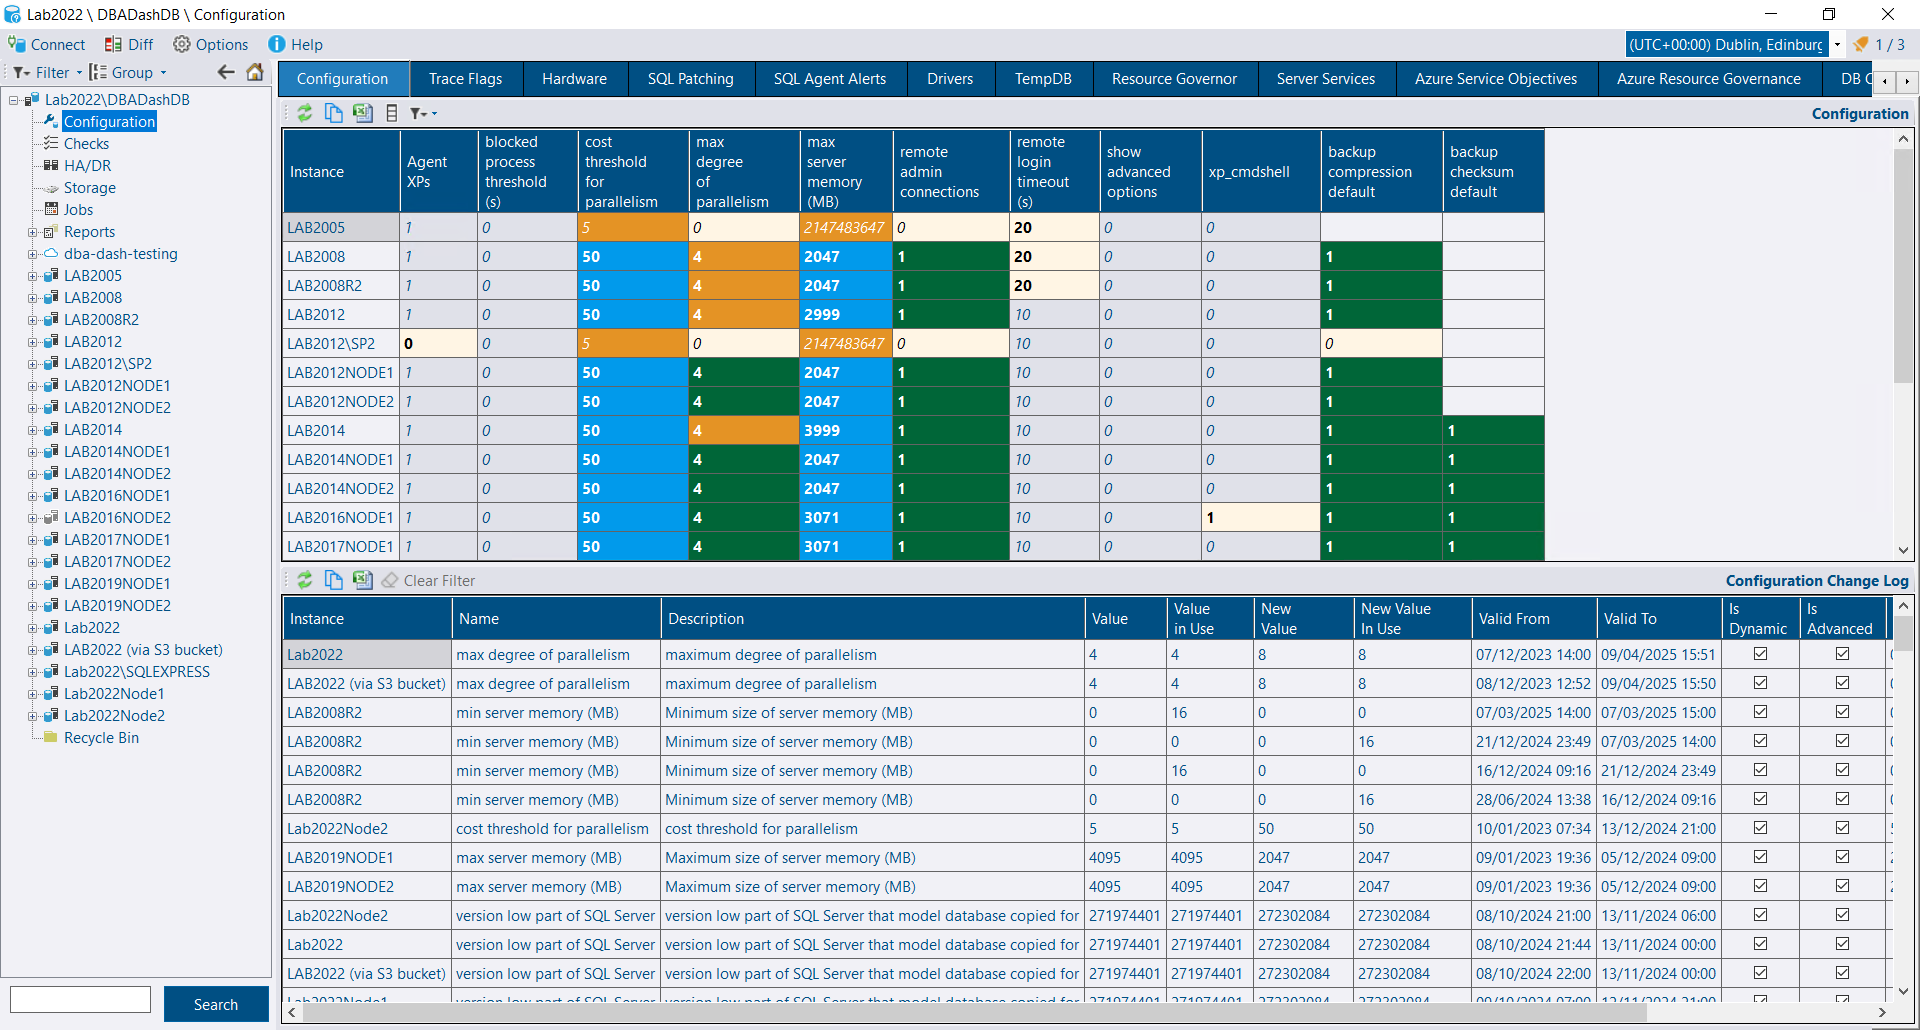
Check configuration settings, trace flags, hardware, patching and tempdb across all servers. DBA Dash automatically tracks when changes occur, including schema changes and SQL Agent job changes.
Query plans, blocking and deadlocks
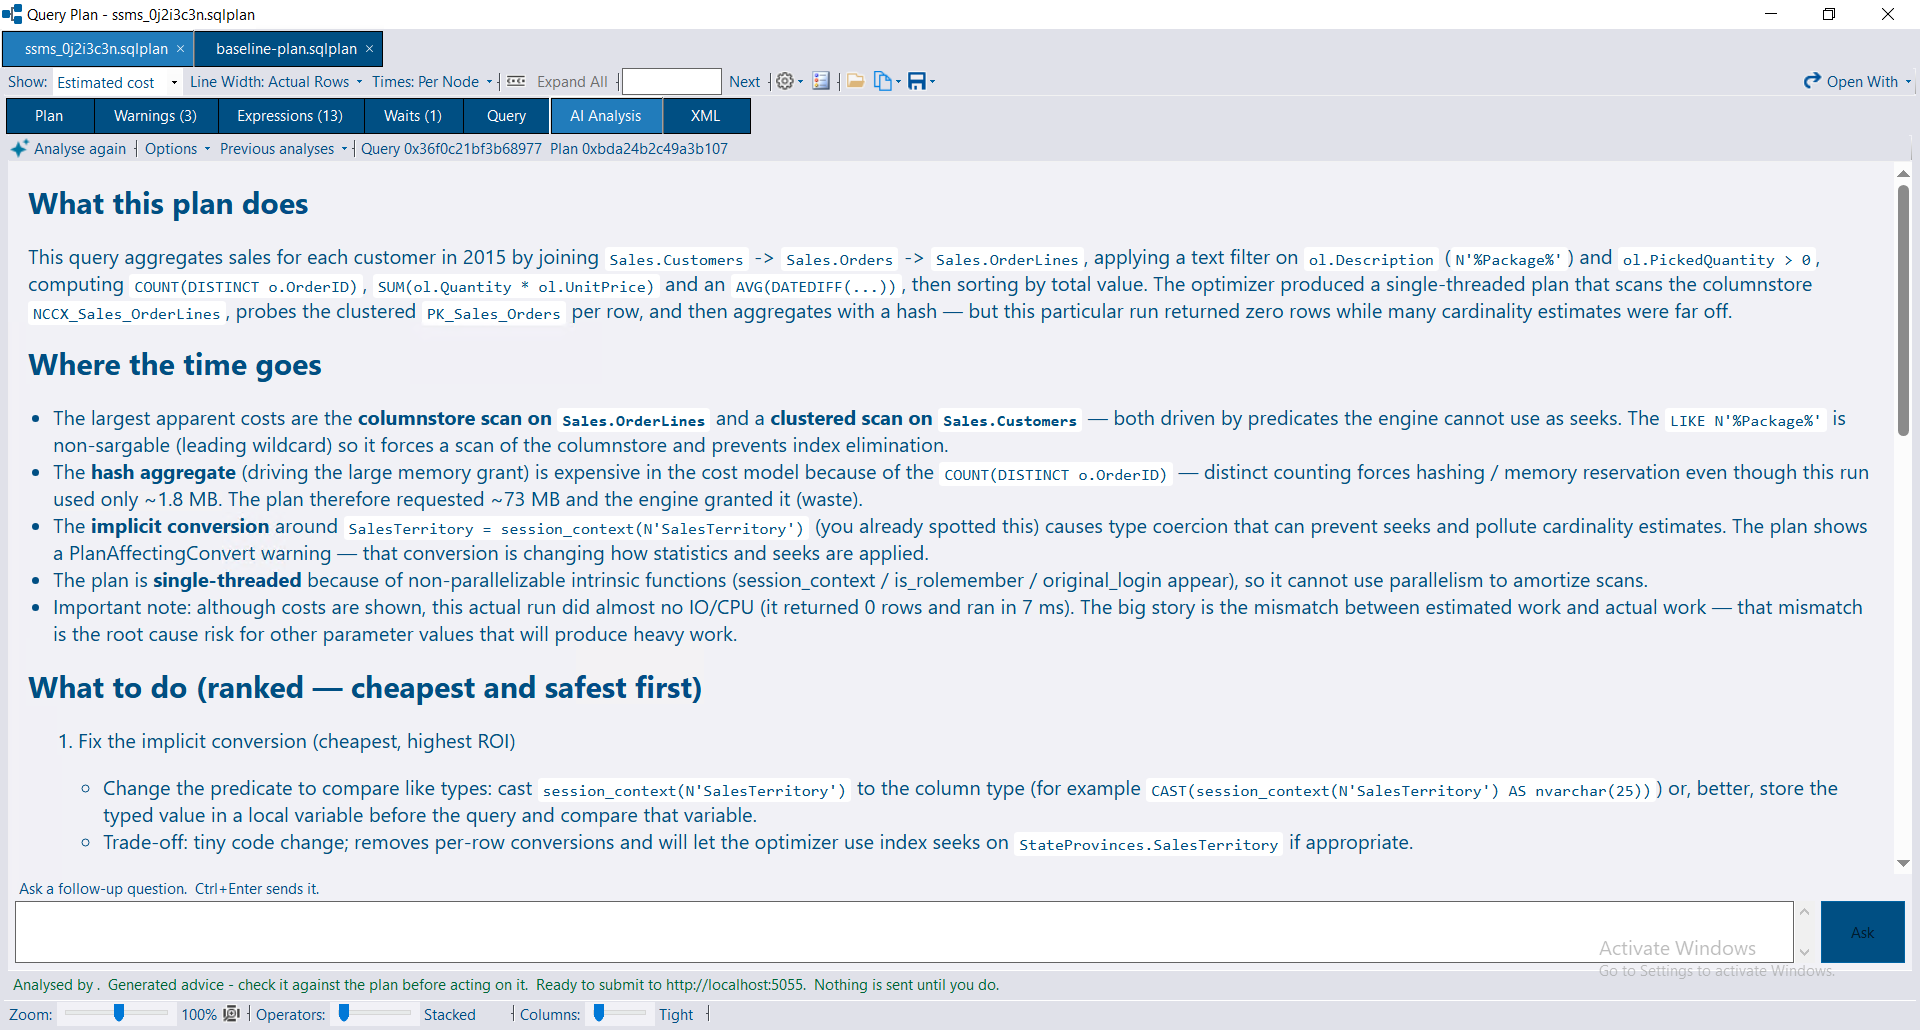
The built-in plan viewer ranks operators by cost, CPU, elapsed time, reads or estimate error, and calls out warnings, bad estimates and missing indexes. Deadlocks are captured and visualized, and blocking chains are shown from running query snapshots.
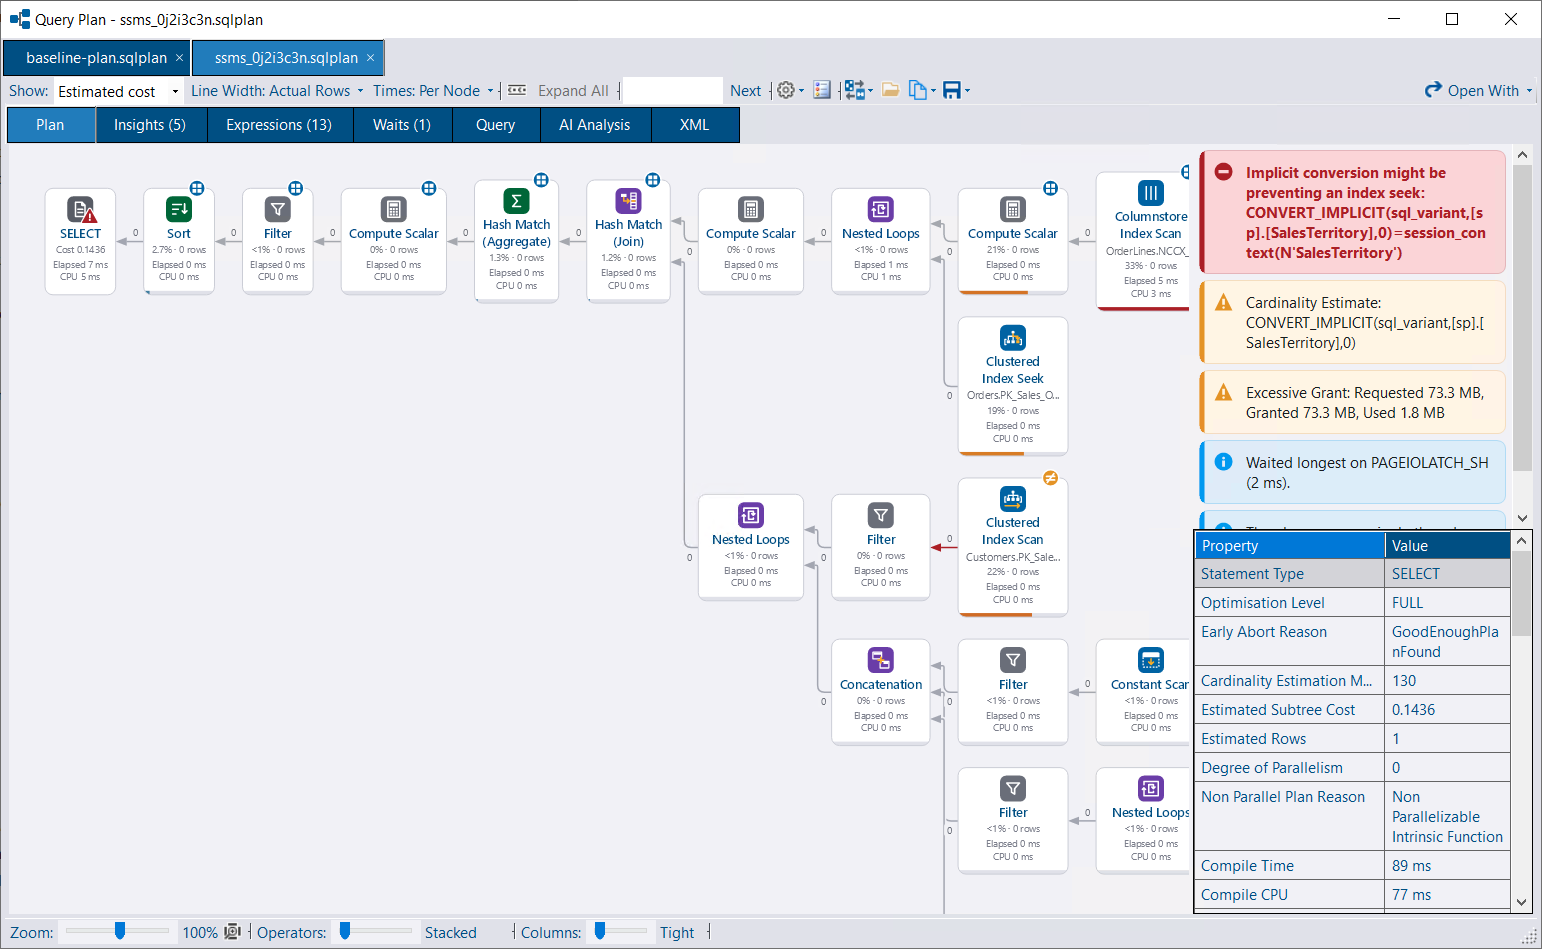
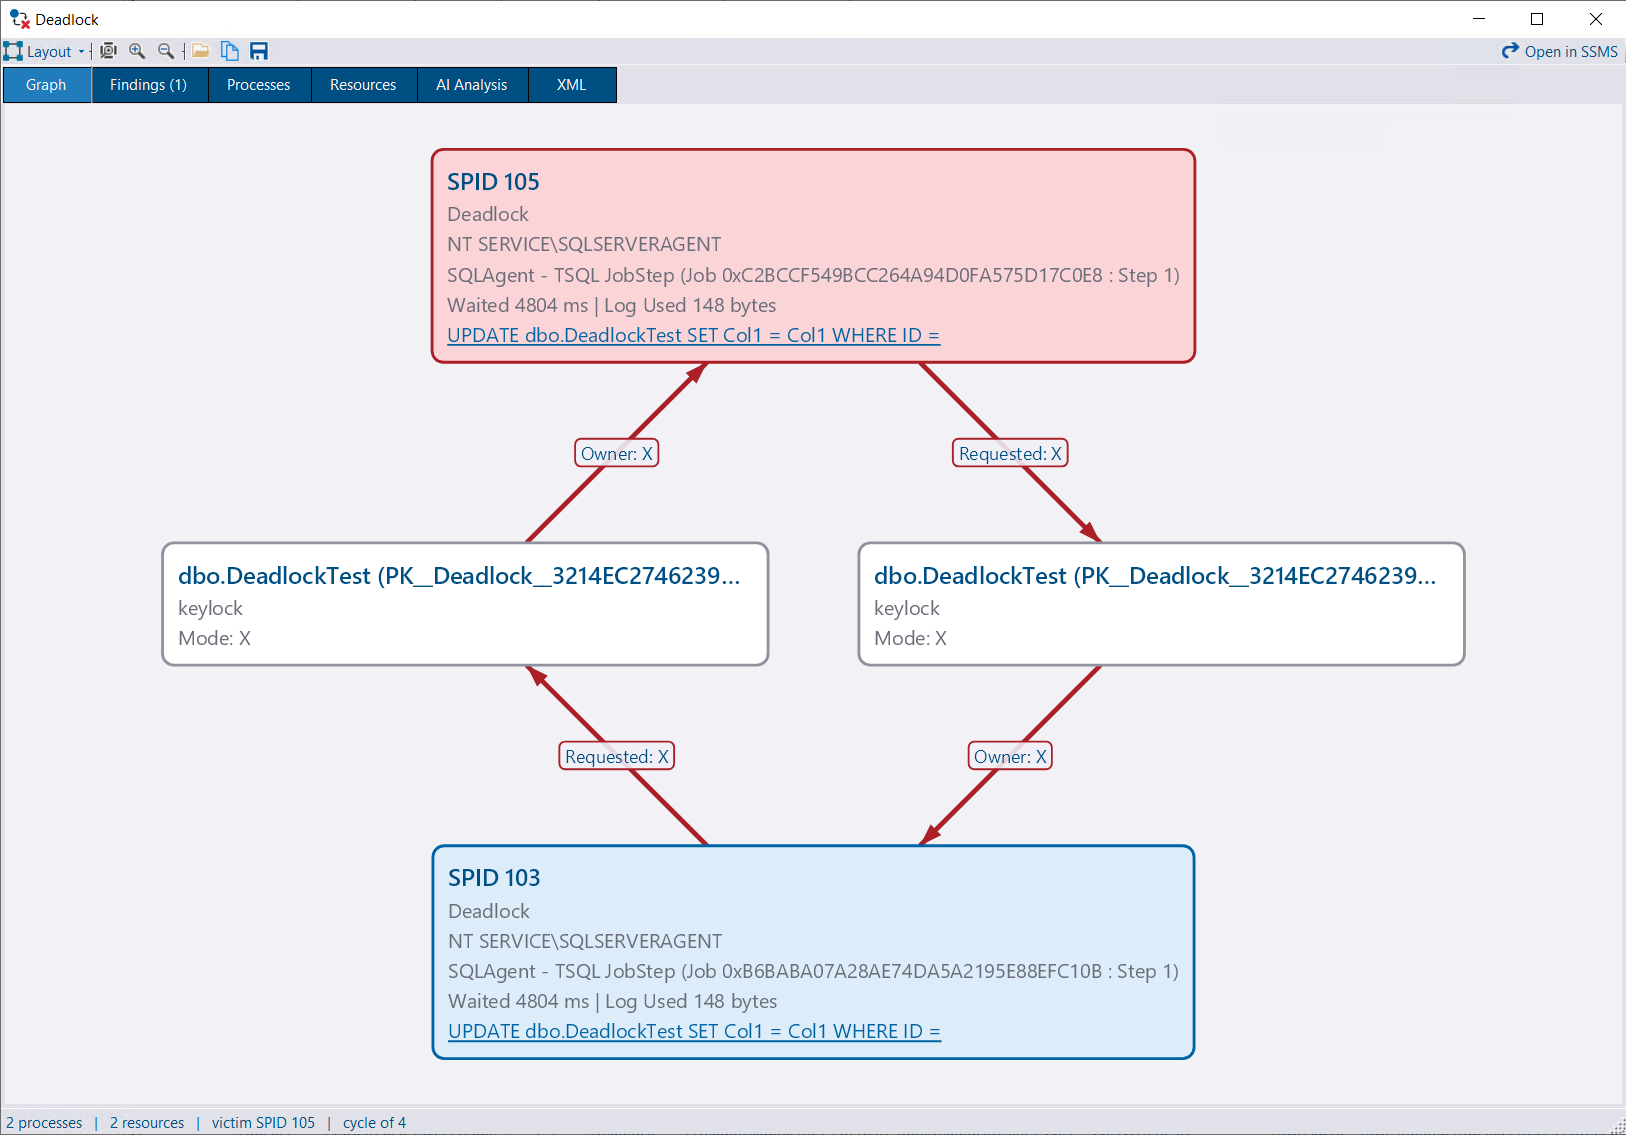
The same plan and deadlock viewers are available in DBA Dash Visualizer, a standalone app that opens .sqlplan and .xdl files with no repository or SQL Server connection needed. It includes an SSMS extension.
AI analysis (optional)
An optional AI assistant can answer questions about your environment and analyse performance, execution plans and deadlocks. Sensitive data can be masked before anything is sent to a model. DBA Dash also includes an MCP server, so tools such as Claude Code and Cursor can query your DBA Dash repository directly.
And more
- Azure SQL Database and Azure SQL Managed Instance monitoring
- Custom checks, custom collections, custom reports and tools
- Deploy community tools to your instances from DBA Dash
- SQL Agent job stats and timeline
- Monitor instances in isolated environments via an S3 bucket
Learn more
- dbadash.com: documentation, setup guides and downloads
- Screenshots: a tour of the whole tool
- Release notes: what’s new in each release
- GitHub: source code, issues and discussions