Intro
The first public release of DBA Dash was in January 2022 and version 2.21.0 is the 24th release.🎉 A lot has changed with many new features added as well as bug fixes. I haven’t really blogged much about the changes, but I thought it might be good to capture what its new for significant releases. So here is what is new and cool in 2.21.0!
Note: You can see the full change log here.
Metrics tab
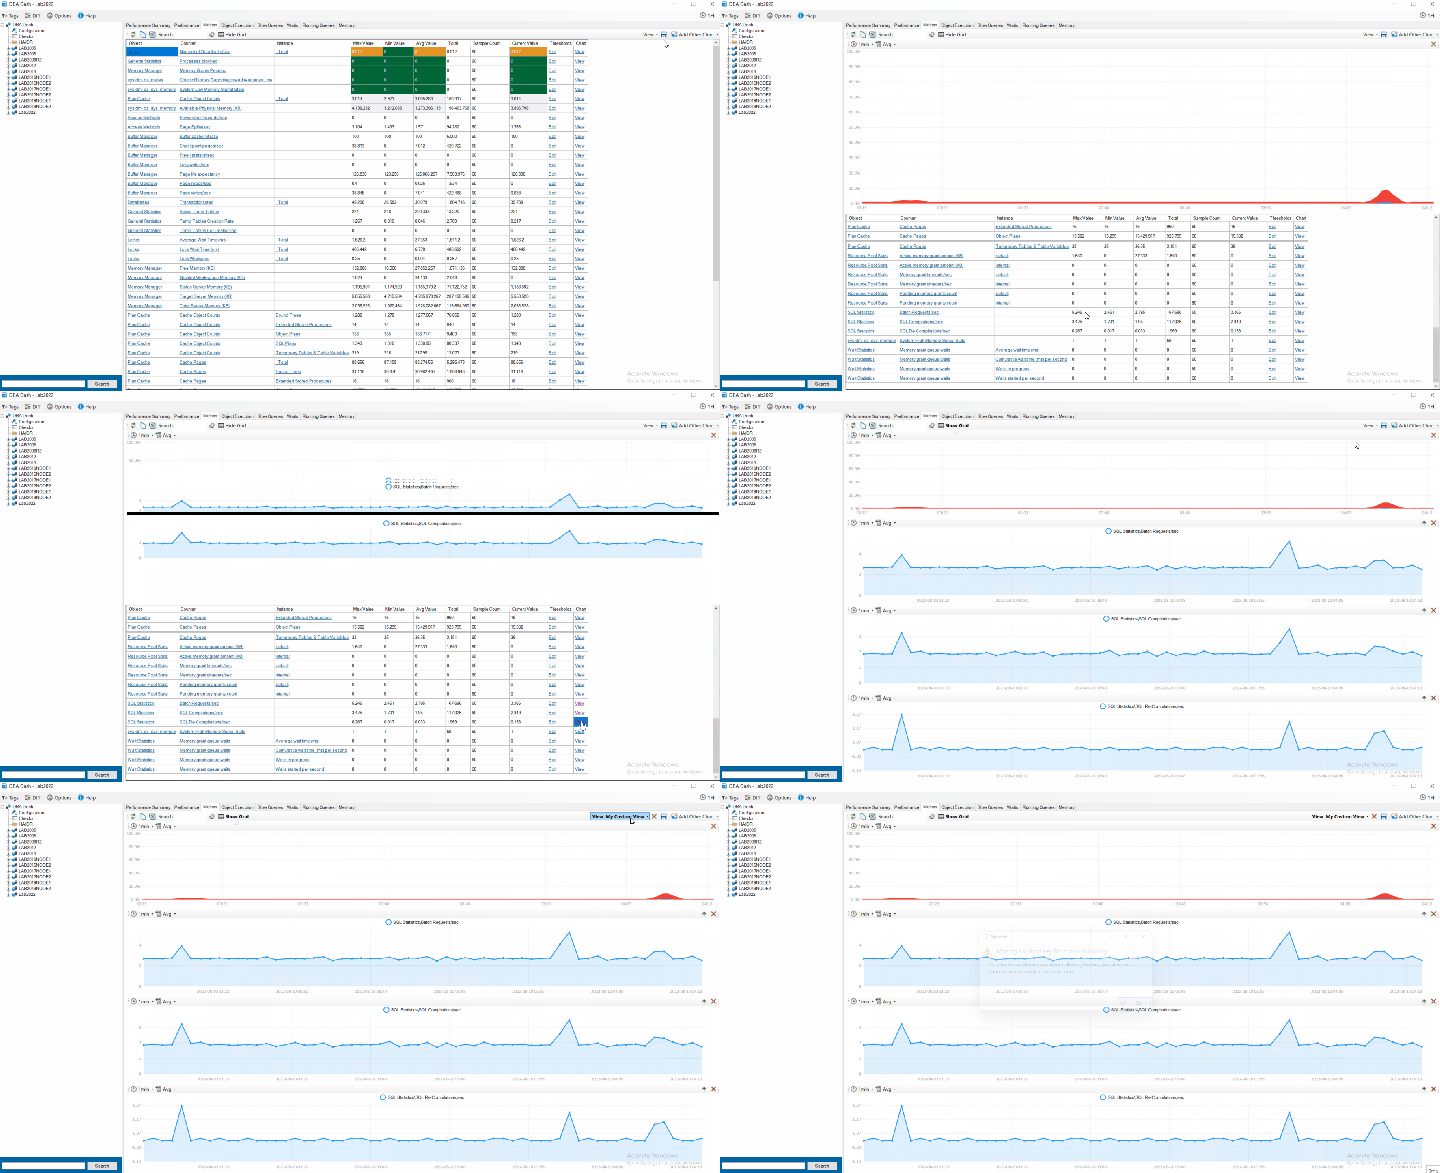
The metrics tab was previously a wall of numbers – the Max, Min, Avg, Total & Current value of all the collected performance counters. At the click of a button you could see a chart for any counter over time for the selected period. It was limited to showing 1 chart at a time.
In 2.17.0 it was possible to configure threshold values for your counters – improving on the wall of numbers by highlighting counters that need your attention.
Now in 2.21.0 when you click view to view a chart for a particular counter, it adds a new chart. You can view charts for multiple counters simultaneously. Also, you can add other charts that are not os performance counters – CPU, Blocking, IO, Object Execution and Waits. This provides additional context for your performance counters. You can re-order the charts and remove them at the click of a button.
Once you’ve created a useful dashboard you can save and re-load it at the click of a button. You can save the view for yourself or share it with your team.
See it in action here:

Tip: You can easily configure which performance counters are collected. Also, you can collect any metric you like that can be queried with T-SQL. See here for details on how to customize the collection.
Performance Summary tab
The performance summary tab now has saved views the same as the metrics tab. You could save the layout previously but it wasn’t possible to save multiple versions or to share those with the rest of the team.
