Data Relay is a free community conference in the UK for the Microsoft data platform. I submitted a session for DBA Dash which was accepted and I delivered my session on the 4th October 2022 in Leeds.
This was the first time I’ve done something like this and it was outside of my comfort zone. I was excited to show off DBA Dash though. My plan was to demo how to use the tool to solve performance issues.
I created demos in my Lab environment and restored the repository database to my laptop to perform the demos.
To help prepare for speaking at data relay I recorded myself. This allowed my to practice my presentation and get an idea how long it would take to deliver. The actual session at data relay wasn’t recorded but I’ve uploaded my practice session to YouTube. It’s a bit rough around the edges, but hopefully you will find the video useful. 😊
Thank you to @MrKeithAtherton for providing the photo from the event!
Some modules such as antivirus software are known to cause issues when loaded into SQL Server address space. These problems might vary from performance issues to weird bugs and corruption. DBA Dash can now highlight where you have problematic modules loaded.
DBA Dash has a new website. The purpose of this site is to provide a friendly landing page for new users of DBA Dash and to provide a better documentation experience.
DBA Dash remains open source and the GitHub page isn’t going anywhere. GitHub is still the place to log issues, create discussions and contribute to the project.
I hope you like the new website and find the documentation easier to navigate. I want to improve the documentation experience over time.
The dbadash.com website was created with Doks. Doks is a theme for Hugo, a static website generator. This the first time I’ve used a static site generator. There is a bit of a learning curve compared to something like WordPress. Static websites are fast, easy to source control and cheaper to host though.
If your table runs out of identity values, you might see an error message similar to the one below:
Msg 8115, Level 16, State 1, Line 7 Arithmetic overflow error converting IDENTITY to data type int.
DBA Dash now has monitoring for identity values. You can see when you are about to run out of identity values which allows you time to plan and fix these problems before they cause errors in your database.
Identity Columns on DBA Dash Summary pageIdentity Columns drilldown
SQL 2022 has the option to use Intel QAT backup compression. In software mode this is supported on standard and enterprise editions. It’s significantly faster, produces higher levels of compression and uses less resources. Hardware mode is just supported on enterprise edition and can significantly offload the CPU cost of compressing your backups.
Glenn Berry has some good articles on this here and here.
So what’s this got to do with DBA Dash? DBA Dash now captures the compression algorithm used from msdb.dbo.backupset for your latest backups. You can now where QAT_DEFLATE compression is in use.
New columns added to capture compression algorithm used for last backup
DBA Dash also tracks sys.configurations settings in use across all your SQL instances, including the new configuration options used to enable QAT_DEFLATE compression. You can see the configuration setting in use and also track when settings have been changed.
The first public release of DBA Dash was in January 2022 and version 2.21.0 is the 24th release.🎉 A lot has changed with many new features added as well as bug fixes. I haven’t really blogged much about the changes, but I thought it might be good to capture what its new for significant releases. So here is what is new and cool in 2.21.0!
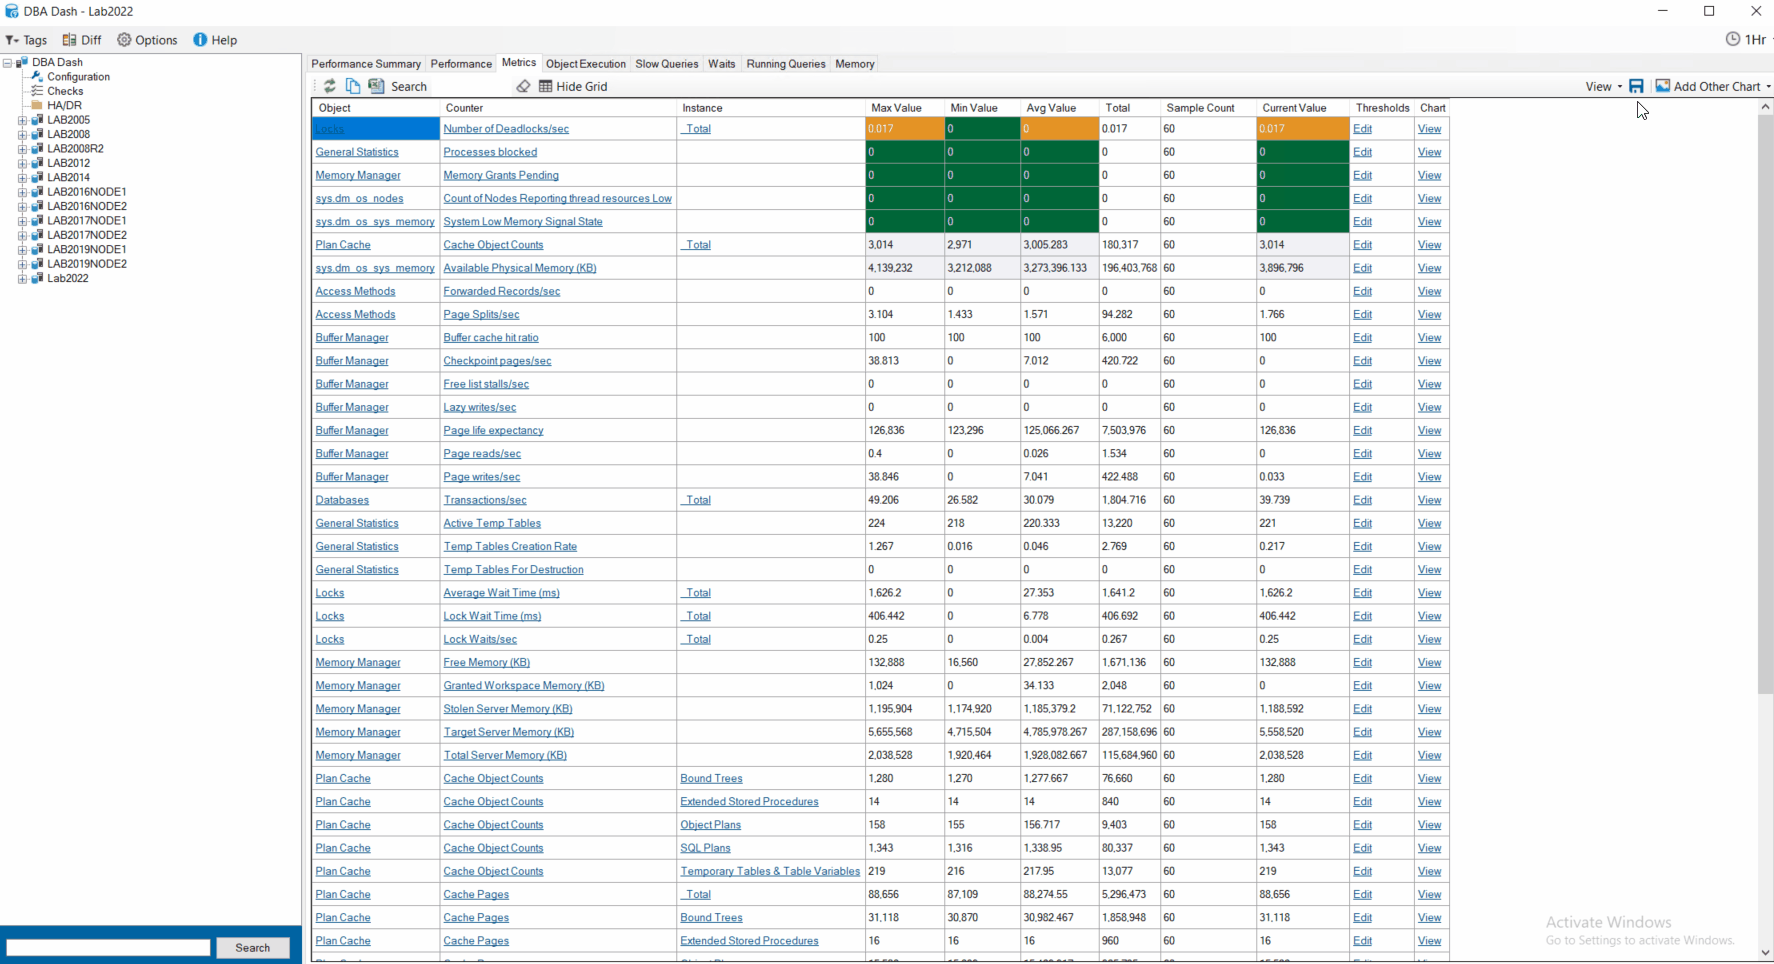
The metrics tab was previously a wall of numbers – the Max, Min, Avg, Total & Current value of all the collected performance counters. At the click of a button you could see a chart for any counter over time for the selected period. It was limited to showing 1 chart at a time.
In 2.17.0 it was possible to configure threshold values for your counters – improving on the wall of numbers by highlighting counters that need your attention.
Now in 2.21.0 when you click view to view a chart for a particular counter, it adds a new chart. You can view charts for multiple counters simultaneously. Also, you can add other charts that are not os performance counters – CPU, Blocking, IO, Object Execution and Waits. This provides additional context for your performance counters. You can re-order the charts and remove them at the click of a button.
Once you’ve created a useful dashboard you can save and re-load it at the click of a button. You can save the view for yourself or share it with your team.
Tip: You can easily configure which performance counters are collected. Also, you can collect any metric you like that can be queried with T-SQL. See here for details on how to customize the collection.
Performance Summary tab
The performance summary tab now has saved views the same as the metrics tab. You could save the layout previously but it wasn’t possible to save multiple versions or to share those with the rest of the team.


