The invitation from Tom Zíka asks “Which quality makes code production grade?“.
Reliability
Code that runs in production should be reliable. It should produce consistent results, handle concurrency and deal with error situations.
Performance & Scalability
Production code needs to be able to scale. Scalability should be considered in the context of your own applications and their expected growth. Not everyone has to deal with the same scalability challenges as Google, Facebook or Twitter.
Performance is also important. It doesn’t matter how awesome your app is if it can’t return data fast enough for end users.
Fast and efficient code can save $$$ in running costs and keep end users happy.
Security
Production code needs to be secure, following industry best practices. A security incident can cause severe reputational damage and financial impact.
Maintainability
Production code should be maintainable. Avoiding duplication and striving for simplicity.
Reviewed
Production code will often go through a code review by another developer before it’s accepted into the codebase.
Tested
Production code will go through a series of automated and human tests before it gets to production.
Accurate?
Production code doesn’t always have to produce accurate results. Accuracy can be very important in some situations. In others, you might be able to trade some accuracy for speed. e.g. Caching data, eventual consistency. The number of active users on a website doesn’t need to be 100% accurate and can be out of date by the time it’s printed.
Documented
Production code should have comments and documentation.
Other
You might have policies for coding standards to follow. This might include things like naming conventions, code formatting and other best practices.
Does it need to be perfect?
Production code doesn’t have to be perfect. Perfect code doesn’t really exist. The code we write today will be viewed through a different lens tomorrow with the benefit of hindsight, experience and new improved ways of doing things.
The code we ship to production needs to be fit for purpose. Shipping code that works and delivers value in a timely manner is often more important than spending months trying to find the most optimal solution. There is a balance to be struck.
Architectural decisions made early in a project can have long-lasting consequences. Making good decisions early in a project can be cheaper than fixing them later.
You can’t always predict how users will use a new feature and how to optimize it. Growing pains are inevitable for successful applications. It’s important to monitor and be proactive in fixing problems.
Not production grade
So what are some examples of code that shouldn’t be in production?
Code that uses undocumented/unsupported features or behaviour
Untested code
Insecure code. e.g. Building dynamic SQL in a way that is prone to SQL injection.
Summary
Production code can vary in quality for a variety of reasons. The experience level of the developer writing the code, time pressures, and level of fatigue all impact code quality.
It’s not unusual for code written as a quick PoC to find its way into production. Code can also start to get messy over time as you start to shoehorn new features into an existing codebase.
If your code is delivering value to the end-user or business you can feel happy about it. Over time we all accumulate technical debt and need to allocate time to reduce it.
Data Relay is a free community conference in the UK for the Microsoft data platform. I submitted a session for DBA Dash which was accepted and I delivered my session on the 4th October 2022 in Leeds.
This was the first time I’ve done something like this and it was outside of my comfort zone. I was excited to show off DBA Dash though. My plan was to demo how to use the tool to solve performance issues.
I created demos in my Lab environment and restored the repository database to my laptop to perform the demos.
To help prepare for speaking at data relay I recorded myself. This allowed my to practice my presentation and get an idea how long it would take to deliver. The actual session at data relay wasn’t recorded but I’ve uploaded my practice session to YouTube. It’s a bit rough around the edges, but hopefully you will find the video useful. 😊
Thank you to @MrKeithAtherton for providing the photo from the event!
Some modules such as antivirus software are known to cause issues when loaded into SQL Server address space. These problems might vary from performance issues to weird bugs and corruption. DBA Dash can now highlight where you have problematic modules loaded.
DBA Dash has a new website. The purpose of this site is to provide a friendly landing page for new users of DBA Dash and to provide a better documentation experience.
DBA Dash remains open source and the GitHub page isn’t going anywhere. GitHub is still the place to log issues, create discussions and contribute to the project.
I hope you like the new website and find the documentation easier to navigate. I want to improve the documentation experience over time.
The dbadash.com website was created with Doks. Doks is a theme for Hugo, a static website generator. This the first time I’ve used a static site generator. There is a bit of a learning curve compared to something like WordPress. Static websites are fast, easy to source control and cheaper to host though.
I was eager to test DBA Dash with SQL 2022 and started testing with the first public release (CTP 2.0). I added a SQL 2022 instance to my lab environment, created using AutomatedLab.
Unlike my other lab machines, I ran through the installer for 2022 manually to get up and running quickly and test the new installer.
DBA Dash only needed some minor modifications to work with SQL 2022. The first and most important step was to add version 16 to the hardcoded list of supported versions and also update some static data for SQL Server 2022. I hardcode the list of supported versions to give me the opportunity to test new versions first and fix any issues.
This initial support for SQL 2022 was added in May. I’ve been running DBA Dash in my lab environment since then and it works well.
DBA Dash – support for new features in SQL 2022
QAT_DEFLATE Backup Compression
Version 2.22.0 adds support for capturing the compression algorithm used on SQL 2022.
Glenn Berry has some good articles on this new backup compression algorithm here and here. I’m getting similar results to Glenn with my own testing using QAT_DEFLATE (software mode) – faster backups, higher compression and lower resource utilization.
sys.databases
SQL 2022 adds some new columns to sys.databases:
is_data_retention_on
is_ledger_on
is_change_feed_enabled
I’m planning to add these to the DBA Dash collection. Only is_ledger_on is currently documented.
Other
On the to-do list is to test DBA Dash with contained availability groups. DBA Dash has monitoring for agent jobs and availability groups so it’s likely some changes will be required in this area.
What I’m excited about in SQL 2022
The intelligent query processing features in SQL 2022 and tempdb concurrency enhancements are very interesting. There is also some really useful language enhancements like GENERATE_SERIES, DATE_BUCKET, GREATEST and LEAST that I can see myself using. Null handling also gets easier with IS [NOT] DISTINCT FROM. I can’t use any of this for DBA Dash as I want to keep the repository compatible with SQL 2016 for now. The language enhancements will be useful for some of the SaaS databases I manage though once we upgrade.
The ability to failover back and forth between Azure managed instance and SQL 2022 is also a game changer. It certainly takes some of the risk out of the process if you are considering using managed instances.
The feature I’m most excited about? Backup/Restore to S3. If you host SQL instances on AWS you have to figure out how to get your backups to S3. There isn’t a standard way to do this. Many people backup to an EBS volume first then push the files to S3 which isn’t ideal. EBS storage is expensive and the two step process to get the backups to S3 adds time and complexity to the process. The restore process is also slower and more complex as you need to pull the backups from S3 first before you can restore them.
The ability to backup directly to S3 is a huge win. It also has value outside of AWS as there are a number of other S3 compatible storage providers.
I’m writing this post to join in with September Free Community Tools Awareness Month. There are many awesome free community tools. I’ve chosen to blog about 3 of them that I think are interesting any maybe less well known in the database community. I’m also taking the opportunity to shamelessly plug my own tool, DBA Dash.
DBA Dash is a monitoring tool for SQL Server. It’s something I use every day and it provides value in several different ways. It supports everything from SQL 2005 to SQL 2022 and Azure DB.
🏎️If you have a performance issue, DBA Dash can help you get to the root cause. You can troubleshoot an issue that is occurring right now or do a postmortem for an issue that occurred weeks ago.
🏥It’s also a tool for health checks. Do you have missing backups, agent job failures, or corruption? Is log shipping, availability groups, or mirroring broken? Are your servers running out of disk space? DBA Dash checks all of these and more. Recently added is a check for identity columns running out of values.
⚙️DBA Dash captures configuration data for your whole SQL Server estate (config settings, trace flags, tempdb). Use the configuration data to check for configuration settings that are different between your SQL instances – great for validating the config of new SQL instances. Check the patch level of your SQL instances. Keep track of when updates were installed and configuration changes made.
l created this tool and I’m also it’s #1 user. The tool is totally free without restrictions or limitations – even better it’s open source. Get it on GitHub.
This video will give you a quick overview of the tool.
Note: This video was created in January when the tool first launched. Many new features and enhancements have been made since the video was created.
AutomatedLab enables you to quickly set up lab environments on Hyper-V and Azure. I use this to create lab environments for DBA Dash on Hyper-V.
The lab environments enable me to test DBA Dash with SQL versions from 2005 to 2022 as well as availability groups, and different configurations. I also use the lab environment as a general playground for learning and experimentation – something useful to have for any DBA.
The power of AutomatedLab is that I can re-create my lab by running a PowerShell script and I can tear it down just as easily. Infrastructure as code!
dbatools is also a key component to setting up my lab environment and it’s one of my favourite community tools. Use this for automating anything relating to SQL Server.
This is a monitoring tool for SQL Server, but unlike DBA Dash it’s not a tool for 24/7 monitoring. I don’t use this tool very often but it can be useful if you are dealing with a particularly tricky SQL issue.
I’ve been a DBA for 17 years and I’ve had a small number of edge case issues that required a phone call to Microsoft product support. During these engagements I’ve been asked to run a pssdiag session and upload it for their offline analysis. You can create your own pssdiag session with SqlDiag Manager and analyse it with SqlNexus.
I would run this tool for short periods of time while you are experiencing particularly tricky issues and use other tools like DBA Dash for your regular monitoring.
This is a Microsoft tool, but like the other tools on the list it’s also open source!
If your table runs out of identity values, you might see an error message similar to the one below:
Msg 8115, Level 16, State 1, Line 7 Arithmetic overflow error converting IDENTITY to data type int.
DBA Dash now has monitoring for identity values. You can see when you are about to run out of identity values which allows you time to plan and fix these problems before they cause errors in your database.
Identity Columns on DBA Dash Summary pageIdentity Columns drilldown
SQL 2022 has the option to use Intel QAT backup compression. In software mode this is supported on standard and enterprise editions. It’s significantly faster, produces higher levels of compression and uses less resources. Hardware mode is just supported on enterprise edition and can significantly offload the CPU cost of compressing your backups.
Glenn Berry has some good articles on this here and here.
So what’s this got to do with DBA Dash? DBA Dash now captures the compression algorithm used from msdb.dbo.backupset for your latest backups. You can now where QAT_DEFLATE compression is in use.
New columns added to capture compression algorithm used for last backup
DBA Dash also tracks sys.configurations settings in use across all your SQL instances, including the new configuration options used to enable QAT_DEFLATE compression. You can see the configuration setting in use and also track when settings have been changed.
The first public release of DBA Dash was in January 2022 and version 2.21.0 is the 24th release.🎉 A lot has changed with many new features added as well as bug fixes. I haven’t really blogged much about the changes, but I thought it might be good to capture what its new for significant releases. So here is what is new and cool in 2.21.0!
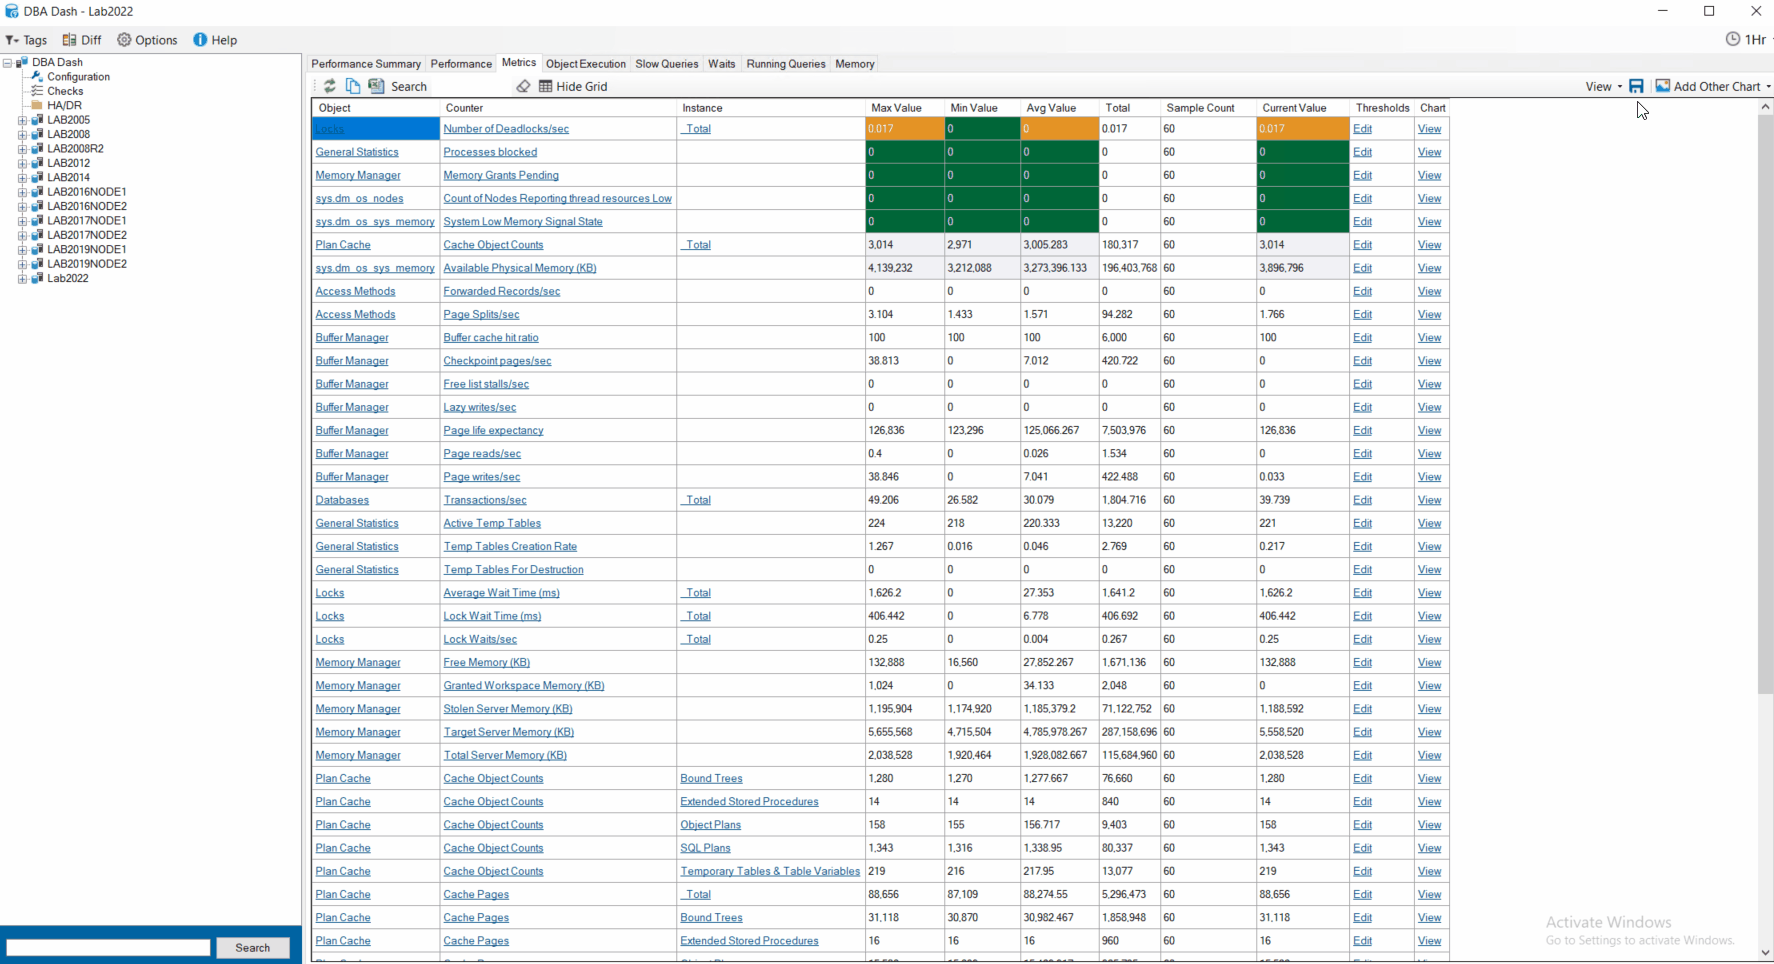
The metrics tab was previously a wall of numbers – the Max, Min, Avg, Total & Current value of all the collected performance counters. At the click of a button you could see a chart for any counter over time for the selected period. It was limited to showing 1 chart at a time.
In 2.17.0 it was possible to configure threshold values for your counters – improving on the wall of numbers by highlighting counters that need your attention.
Now in 2.21.0 when you click view to view a chart for a particular counter, it adds a new chart. You can view charts for multiple counters simultaneously. Also, you can add other charts that are not os performance counters – CPU, Blocking, IO, Object Execution and Waits. This provides additional context for your performance counters. You can re-order the charts and remove them at the click of a button.
Once you’ve created a useful dashboard you can save and re-load it at the click of a button. You can save the view for yourself or share it with your team.
Tip: You can easily configure which performance counters are collected. Also, you can collect any metric you like that can be queried with T-SQL. See here for details on how to customize the collection.
Performance Summary tab
The performance summary tab now has saved views the same as the metrics tab. You could save the layout previously but it wasn’t possible to save multiple versions or to share those with the rest of the team.
SQL Server can store binary large objects such as files inside the database. Why might you want to store files inside the database? What problems might it cause and what alternative options should you be considering?
Background
I have experience managing several large SQL databases consisting of up to 160TB of blob data – using in database BLOBs as well as FILESTREAM. If you think you might need to store hundreds of GB or TBs of BLOB data you should think very carefully about where you place that data – your SQL Server database might not be a good solution! It can be made to work and I’ll provide some tips in this article but ultimately we ended up migrating our BLOBs out of SQL. In this article, I’ll explain why you might want to consider alternative options and how to manage huge volumes of blob data in SQL.
Why store in the DB?
FullText indexing. This is the most compelling reason to store your blobs in the database in my opinion. There are alternative options to consider like Elastic Search which I actually think is better and more flexible than FullText search in SQL Server. Fulltext search is seamless though and easy to implement.
Transactional consistency I’ve seen this argument used as a reason for storing blobs in the DB, but I think in most cases you can engineer what you require with the blobs stored externally. For example, you could commit the blob to an appropriate store first then add the associated metadata to the DB – ensuring you don’t have any metadata without an associated BLOB? A process could be added to clean up orphaned BLOB data. Or use a queue to ensure reliable processing of both the blob and metadata? Note: You need to use explicit transactions to get transactional consistency in the database. Large BLOBS could create long-running transactions which result in blocking and poor concurrency. Doing the BLOB operation as the first part of the transaction is probably the best option if you need this.
Easy backup/restore Backup/Restore is probably a compelling reason NOT to store your files in the DB (discussed later), but there is a simplicity in having all your ‘content’ data included in a database backup file. Also, your DB and blobs will be transitionally consistent if you need to rollback to an earlier time – ensuring no orphaned blobs or metadata (provided you used explicit transactions).
The Problems
DB size! Your databases can potentially grow to enormous sizes. Most of the negatives below are related to this. If you don’t expect to store very large volumes of BLOB data some of these issues might not apply. Evaluate the information in this article and make an informed decision for your use case.
Storage costs The database is probably the most expensive place to store your BLOB data. If you are hosting in the cloud you might find that there are options that are significantly cheaper and have better durability (e.g. S3, Azure blob).
Backups Your database backups are going to be large! Also, because they are large they are going to be SLOW and EXPENSIVE! They are also inefficient to backup in the database.
Restores If backups are slow as a result of BLOB data, also think about restores. DR/HA also becomes critical as you move into VLDB territory.
DR/HA This becomes more necessary and also more expensive as a result of storing BLOB data in your DB. Your DR copies also need to include the blob data. Looking to scale out reads with AlwaysOn AGs? The extra storage cost for the BLOBs will add up.
DBCC checks Make a coffee, it’s going to take a long time! You might need to think of partitioning your DBCC checks so that they can complete out of hours. DBCC checks are very resource-intensive and blob data pushing your DBs into VLDB territory can create significant challenges here.
Risk of Corruption Corruption is usually the result of a SQL Server bug, driver, or hardware failure. With larger volumes of data, you could be more at risk.
Performance SQL Server licensing is expensive and there is some CPU overhead in serving files from your DB. Also, if you are not using FILESTREAM the data pages associated with the BLOB data will consume space in the buffer pool – wasting valuable physical memory.
2GB size limit for in database BLOBs.
Removing files doesn’t automatically reclaim any space (in database blobs)
Inefficient Backup
Why are backups of BLOB data inefficient in the database? Upload a new file into your database – how many times is it backed up?
In the next transaction log backup.
In the next diff backup – and the next until a full backup is taken.
Every full backup from now until the end of time or the blob is deleted. Regardless of if the file has changed.
So how often should it have been backed up? Just Once. You might want multiple copies for redundancy but you don’t need to keep backing up files that don’t change. If you choose to store your files in the database you don’t have that option. Your backups and restores are going to be slow and inefficient. What if disaster strikes and you need to restore from backup? How long will that take and what pain will it cause the business?
What about FILESTREAM?
FILESTEAM is a hybrid approach giving you all the benefits of storing blobs in the DB with non of the downsides RIGHT? Not quite…
Filestream solves the problem of blobs consuming space in the buffer pool. It solves the 2GB limitation imposed for traditional BLOBs and it also provides a more efficient way of streaming larger BLOB data. Filestream data doesn’t count towards the 10GB SQL Express limitation – which might allow some people to stay on the free edition of SQL Server a while longer.
It solves some problems, but this shouldn’t be considered a best of both worlds solution as most of the issues mentioned still apply to FILESTREAM. For instance, It doesn’t help with DB size, backup/restore, storage costs, DR/HA, DBCC, or potential for corruption. It maybe helps to some extent with performance – but you are still adding extra load to your DB server.
If you are going to store blobs in SQL Server larger than 1MB, FILESTREAM is probably the best option. For smaller blobs, it might be more efficient to store in database. The best option? Skip FILESTREAM and store the blob data completely outside the database.
If not the DB, Where?
If you are running in the cloud you should look towards solutions similar to S3 or Azure blob. For example S3 is cheaper and has better durability than EBS volumes. Also, with cloud blob storage you don’t have to worry about expanding drives or running out of space (just paying the cloud provider bill).
If you need fulltext indexing, there are alternative solutions like ElasticSearch or Solr that are worth looking at. Those solutions will require you to extract the RAW text from your BLOB data where this could be done automatically for you in SQL Server with IFilters. Apache Tika might be an option to consider as an alternative. IFilters are maybe still an option but you would have to write the code to extract the text yourself using something like IFilterTextReader.
Note: Fulltext is quite a compelling reason to use SQL Server for blobs. I think there are better alternatives but they all require more effort to develop. For smaller projects where you need fulltext search, storing blobs in the DB is an option to consider. For larger projects that predict high volumes of data I would look at alternative solutions. It’s more effort but it could prove cheaper in the long run with more efficient storage, backups etc.
I still need to store my BLOBs in the DB. Help!
As volumes of data increase, backups, restores and DBCC checks become increasingly difficult. The largest DB I managed grew to 160TB which would require a sustained average backup rate of 970MB/sec to complete a FULL backup within a generous 48hrs window. So how do you cope as volumes of data increase? Throwing money at your hardware vendor might be one solution, but there is another option…
Partitioning is the key! Ideally your blob data is immutable (INSERT Only). This is something you can engineer but you might need to consider things like GPDPR. I would recommend partitioning your blob data by date and using separate filegroups per partition. This allows you to mark older filegroups as readonly. You need to create one off backups of your readonly filegroups and then you can create regular backups of just the writable filegroups. This can seriously cut down on the size of your weekly backups.
Note: Marking filegoups readonly requires exclusive access to your database. This means a very brief outage to mark filegroups readonly which isn’t ideal. Storing your blobs in a separate DB might be an option to consider to limit the impact of this. If you need to delete data in your readonly filegroup you will first need to mark it writeable (exclusive access required again). You would then delete as normal and mark the filegroup readonly again. At this point a new FULL backup of the filegroup is required.
What if my table isn’t INSERT only?
If you expect the data to be mostly readonly you could handle updates as an insert operation and update any references to point to the new blob. You can keep a version history for your blobs in this way which might be useful for your application. Deletes could also be done as a “soft” delete where you remove the pointers to the blob.
In some cases there might be a legal obligation to physically delete data and a soft delete won’t cut it. Or maybe the quantity of update and delete operations is high so you can’t make the table insert only without adding significantly to your data storage problems. Ideally this is another reason to consider moving the files out of the DB.
Filegroups can still be useful in this scenario. If you have filegroups with older, less volatile data you can take less frequent FULL backups of these filegroups. You will still need to take regular diff backups of these filegroups but the diff backups will be quite small.
What about DBCC?
You can run DBCC checks at the FILEGROUP level which allows you to partition your DBCC checks. You can prioritize running checks for your writable filegroups which are most at risk from corruption.
What about Restore?
Restores are still going to be slow. Also if you are using FILEGROUP backups your restores have become more complex. If you get this wrong you might be in a position where you are unable to restore your database. The individual filegroup backups represent your database at different points in time – you need to bring these to a transactionally consistent point in time to recover your database. You do this by applying your diff and transaction log backups.
With filegroup backups, you might have some additional options available to bring things online much faster. It’s possible to do an online piecemeal restore where you recover the “active” part of your database and bring it online. You can then restore your older filegroups while users are accessing the database. This is an enterprise edition feature though.
More Info
Some of the topics in this article I’ve only covered briefly like partitioning and online piecemeal restores. I’d recommend viewing the MCM (Microsoft Certified Master) videos on online piecemeal restore. It’s no longer available on Microsoft’s website, but SQL Skills has it here.
The big shrink of 2019:
DBA Dash captures the moment when blob data was removed from one of our databases back in 2019. The files were moved to cloud blob storage and the associated table, files and filegroups were simply dropped from the database. No actual shrinking required which would have been a slow and painful process!
All monitoring tools have some overhead associated with them but generally, the overhead is low compared to the value they deliver. How much load does DBA Dash add to a server?
To find out I setup an extended event to capture the queries ran by the DBA Dash agent. I left the trace running for over 8hrs (8:23:33, ~504mins). This was done on a real production server – one of our busiest servers that supports a SaaS application. This was done during peak load. The results are valid for this server running version 2.13.1 of DBA Dash.
TLDR: The overhead of running DBA Dash is very small and it delivers great value!
The queries with 504 samples are been run every 1min with RunningQueries sampled 1008 times on this server as it was changed to collect every 30 seconds instead of every 1min.
Of these frequently ran query captures, ironically it’s the SlowQueries capture query that is the slowest. The query has a 1-second delay built in while it starts a new extended event session before flushing the ring_buffer of the old one. It’s better to look at the average CPU time of 295ms for this query. It’s still the heaviest of the queries that are collected every 1min.
This is quite a busy production server and SlowQueries captures all queries taking longer than 1 second to run. This collection isn’t enabled by default and you can configure the threshold for collection as required.
The next slowest of the frequently executed queries is the RunningQueries capture with a 92ms average execution time. I’ve previously compared this to sp_WhoIsActive. In a lab environment with 12 active queries the average duration was only 15ms. So results will vary depending on your workload. The Plan Collection and Text Collection also form part of the RunningQueries capture with plan collection been optional.
Of the hourly collections, it’s the DBFiles collection that is the slowest. The overhead of this query will likely be different on your server depending on the databases and files on your SQL instance.
Other Caveats
The Slow Query capture doesn’t take into account the overhead of the associated extended event.
The repository database is on a different server. If you host both on the same server you will have additional overhead.
The DBA Dash agent is ran on a different server. If you run the agent on your monitored SQL instance this will also add additional overhead.
The results above are valid for this server with version 2.13.1 of DBA Dash.
See here for a list of what DBA Dash captures and when. The analysis above doesn’t include collections that are ran daily as they didn’t fall into the 8hr window of this test.
You have full control over the collection schedule. Disable some collections or change the frequency as required!
How to test
I’ve posted the results above to give an indication of the overhead of running DBA Dash. If you want to monitor the activity on your own server, this extended events session will get you started:


